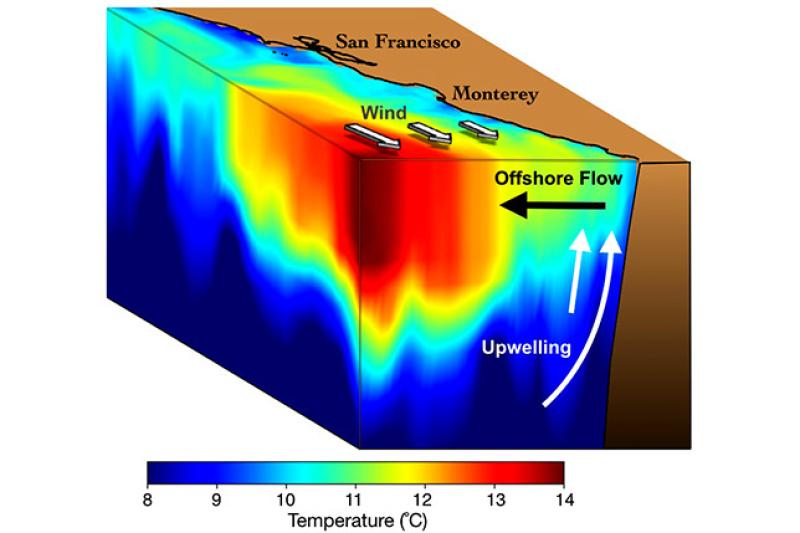
Winds blowing to the south, especially in spring and summer, drive water offshore near the ocean surface. As water moves offshore, it is replaced by cold, nutrient-rich water from below. This process, called upwelling, supports a highly productive marine ecosystem off the West Coast. Newly developed indices quantify the intensity of upwelling and its delivery of nutrients to the ocean surface more accurately than ever before.
Great volumes of nutrient-rich water welling up from the deep ocean fuel the West Coast’s great diversity of marine life. Now scientists using satellite images, research buoys, ocean models, and other ocean monitoring tools have brought the upwelling into much sharper focus, measuring even the velocity of the water and the amount of nutrients that it delivers.
Scientists described new “upwelling indices,” which represent a breakthrough in understanding the biological engine that drives the West Coast marine ecosystem.
“Upwelling is vital to marine life along the West Coast, but the tools we were using to monitor it hadn’t changed much in almost 50 years,” said Michael Jacox, a research scientist at NOAA Fisheries’ Southwest Fisheries Science Center who developed the new indices. “Now we’re bringing state-of-the-art tools and the latest science to bear to help us understand how upwelling supports and shapes the California Current Ecosystem.”
Given the ecological importance of upwelling, scientists and managers are eager for indices that allow them to monitor its variability and understand its impacts on coastal ocean ecosystems.
Jacox, of the Southwest Fisheries Science Center and NOAA’s Earth System Research Laboratory, and other researchers from NOAA Fisheries, and the University of California at Santa Cruz, recently published the new upwelling measurements new upwelling measurements  in the Journal of Geophysical Research: Oceans and the indices are also available online. Maps based on the indices reveal through color-coding where upwelling is most pronounced, such as off Cape Mendocino in California.
Upwelling occurs along certain coastlines around the world where winds and the Earth’s rotation sweep surface waters offshore, drawing deep, cold, and salty water full of nutrients up to the surface. These nutrients fuel growth of phytoplankton that form the base of the marine food web, and ultimately nourish the West Coast’s ocean ecosystem from sardines to sperm whales.

“We’ve never had the kind of resolution to see all this before,” said Toby Garfield, director of the Southwest Fisheries Science Center’s Environmental Research Division. “This gives us a much better understanding of the nutrient supply that’s really getting at the drivers at the base of the food chain.”
Earlier upwelling indices based on theory developed in the early 1900s relied on coarse atmospheric data. The “Bakun index”, developed by a Southwest Fisheries Science Center researcher in the early 1970’s, has long served as an instrumental resource in oceanographic and fisheries research along the West Coast. The new indices incorporate additional marine data and technological advances in ocean modeling to calculate the strength of upwelling as well as the nutrients it contributes, in 17 locations along the West Coast.
“The picture that we get from these indices is more accurate and finely resolved, so we get a clearer picture of what’s driving the system,” Jacox said. “This enables a better representation of the relationships people are trying to explore between ocean dynamics and marine life.”
Researchers studying fisheries or other marine life, for example, can use the indices to understand how fish and marine mammals respond to changes in upwelling and nutrients in the ecosystem. The indices help reveal the effects of shifting ocean conditions off the West Coast, which in recent years has experienced unusually warm temperatures that affected many species.