The 2019 Northeast fall ecosystem monitoring survey aboard NOAA Ship Gordon Gunter sampled 117 stations along the U.S. East Coast. In all, 75% of the cruise objectives were accomplished. The limited number of available days at sea was the main reason more stations were not completed, although weather delays were also a factor.

Complete coverage was achieved for the Mid-Atlantic and Southern New England regions and 97% coverage on Georges Bank. There was reduced coverage in the northern survey area, 22% in the Gulf of Maine and no coverage of the Scotian Shelf.
The core measurements taken during the ecosystem monitoring cruises help researchers understand and predict seasonal and yearly changes in the Northeast ecosystem and its fisheries.
Core Sampling Summary
Plankton Collection
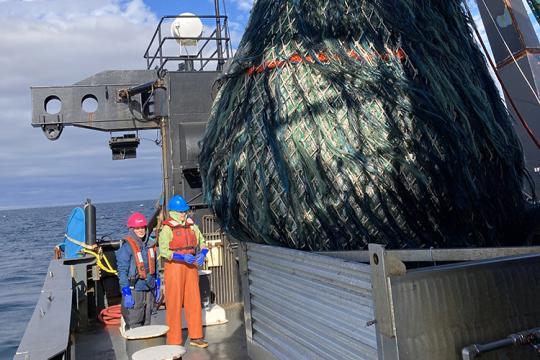
Long-term sampling on this cruise includes “bongo” net tows. Fine-mesh “bongo” nets are attached to side-by-side aluminum rings, which resemble bongo drums when deployed. Researchers conducted bongo net tows at 100 different stations.
Samples collected include fish larvae, fish eggs, sub-adult squid, and zooplankton (tiny animals, mainly crustaceans, and very young stages of some larger animals). Zooplankton provide information about the food chain supporting fisheries and marine mammals. Scientists use larval fish and egg samples to learn more about fish stock abundance.
Conductivity, Temperature, and Depth Profiles
Seawater conducts electricity. This “conductivity” is used to estimate seawater salinity. The crew deployed an instrument that can measure conductivity, temperature, and depth—or CTD—at all 117 stations on this survey. The combination of temperature and salinity at various depths helps define marine habitat boundaries, track ocean circulation, and monitor changes in climate. This information can help explain changes in marine species distribution and productivity.

Ocean Acidification Monitoring
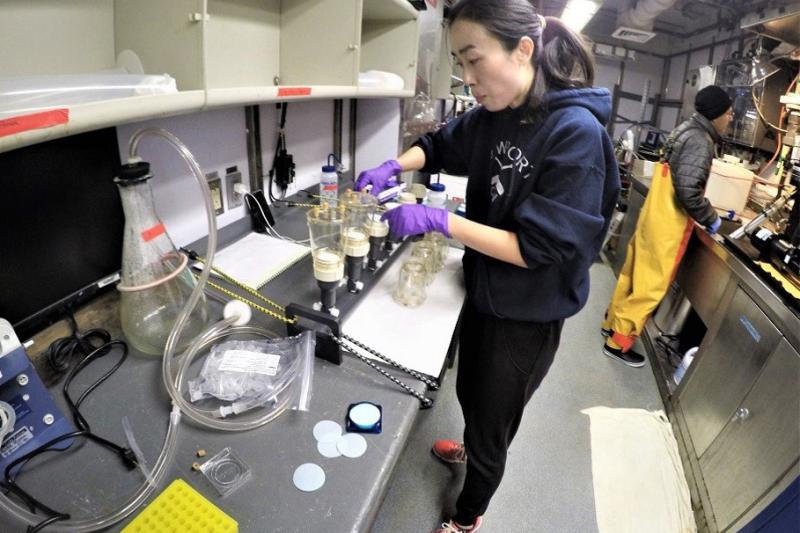
To monitor marine carbon cycling and ocean acidification, scientists collected water samples and measured dissolved inorganic carbon, total alkalinity, pH and nutrients at 24 stations. Increases in dissolved carbon dioxide can increase the acidity of the water, which can in turn affect shellfish and other sensitive organisms. The NOAA Ocean Acidification Program funded this work, conducted in partnership with NOAA’s Atlantic Oceanographic and Meteorological Laboratory in Miami.
Special Collection Summary
Special Collection research on this cruise included:
-
We collected water samples to look for genetic material shed into the environment by marine organisms. This environmental DNA can identify which species are present in a location. This work is led by the NEFSC Population Biology Branch, with assistance from the NEFSC Ecosystem and Aquaculture Division.
-
We filtered seawater samples to measure methyl mercury concentrations in the environment for a researcher from the University of Connecticut who was also along as part of the scientific crew.
-
We deployed ring nets alongside standard bongo nets during tows at two stations to compare the samples collected. The Department of Fisheries and Oceans Canada’s Atlantic Zone Monitoring Program uses ring nets for plankton sampling. This experiment is part of our work to find ways of combining data collected by each country in the Gulf of Maine and Georges Bank.
-
Researchers took optical measurements for a University of Rhode Island project that uses ocean color measurements derived from satellite images to identify sizes and types of phytoplankton. NOAA’s Joint Polar Satellite System Proving Ground and Risk Reduction Program funded the work. Partners include researchers from NOAA and the Woods Hole Oceanographic Institution.
-
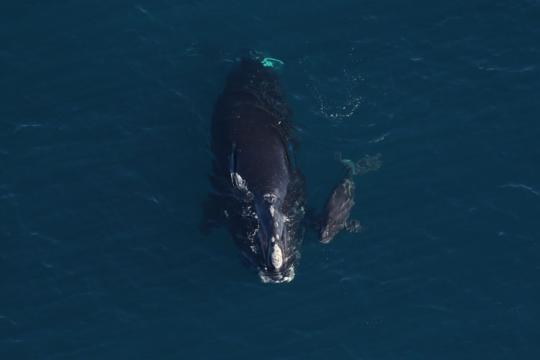
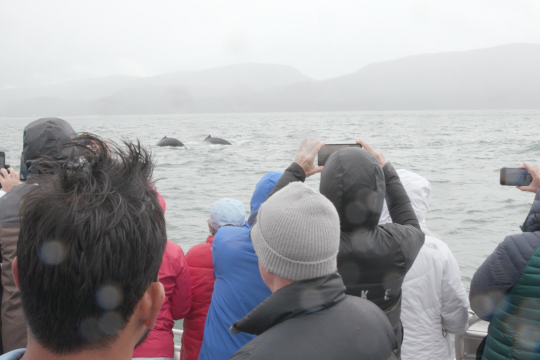
Two observers monitored for seabirds, marine mammals, and sea turtles we encountered. This is part of the Atlantic Marine Assessment Program for Protected Species, a partnership among scientists from NOAA, the U.S. Fish and Wildlife Service, the Bureau of Ocean Energy Management and the US Navy.
-
We used an imaging flow cytobot, a kind of underwater microscope, to image and count phytoplankton cells continuously from surface waters during the ship’s transit. This work is part of a National Science Foundation project led by Woods Hole Oceanographic Institution with collaborators from the University of Massachusetts Dartmouth, the University of Rhode Island, Wellesley College, and NOAA Fisheries.
The Northeast Fisheries Science Center collaborates with other agencies and institutions, supporting research that enhances core sampling. On this cruise, sampling supported both new and ongoing projects with the University of Rhode Island, the Woods Hole Oceanographic Institution, University of Connecticut, the Department of Fisheries and Oceans Canada, the Bureau of Ocean Energy Management, the U.S. Fish and Wildlife Service, and a variety of groups within NOAA.