Our Ecosystem Monitoring cruises help researchers understand and predict changes in the Northeast shelf ecosystem and its fisheries. Core sampling on the spring EcoMon includes the distribution and abundance of zooplankton and larval fish, temperature, salinity, and samples we use to study ocean acidification. Researchers also collect observations of seabirds, marine mammals, and sea turtles. Egg data from this survey are important for managing Atlantic mackerel in U.S. and Canadian waters.

We visited 150 stations between May 31 and June 17. Because we had fewer available days at sea and an unexpected exchange of crew, we dropped 17 of our planned stations. Most of the lost coverage occurred between Chesapeake Bay and Cape Hatteras, North Carolina. Fortunately, calm seas allowed the team aboard the NOAA Ship Henry B. Bigelow to complete coverage of the southern New England and Georges Bank areas. We nearly completed coverage of the Gulf of Maine, and increased sampling in the Nantucket Shoals wind energy area.
The plankton—tiny animals and young stages of some larger ones—we gather provide information about the food chain supporting fisheries and marine mammals. Scientists use our larval fish and egg samples to learn more about fish stock spawning and help estimate stock abundance. By measuring physical and chemical conditions like temperature and salinity, we can describe ecosystem productivity, spawning, larval recruitment, fish condition, and species distributions.
Core Sampling Summary
Plankton Collection

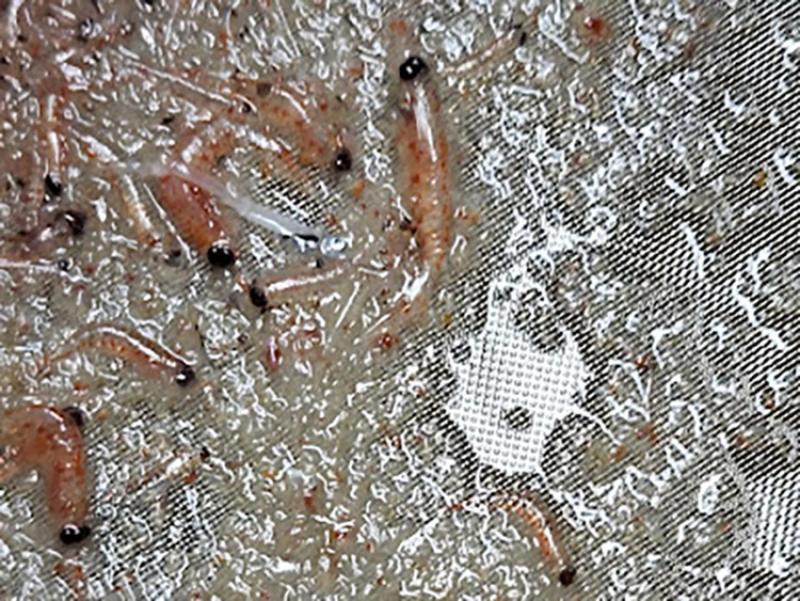
During this survey, we conducted “bongo” net tows at 138 different stations. We attach fine-mesh nets to adjoined steel rings, causing them to resemble bongo drums when deployed. Bongo net tows collect zooplankton, larval fish, and fish eggs. Researchers will use samples from this survey to update an index of Atlantic mackerel egg abundance used in the stock assessment.
At the beginning and end of the survey, we conducted supplemental plankton sampling within five Wind Energy Lease Areas:
- Liberty Wind
- Vineyard Wind
- Mayflower Wind
- South Fork
- OCS-500
Conductivity, Temperature, and Depth Profiles
The crew deployed an instrument that can measure conductivity, temperature, and depth at all 150 stations on this survey. Seawater conducts electricity. This “conductivity” varies with the amount of dissolved salts in the ocean, and scientists use it to estimate the salinity of seawater. The combination of temperature and salinity at various depths helps define marine habitat boundaries, track ocean circulation, and monitor changes in climate. This can help explain changes in marine species distribution and productivity.
Ocean Acidification Monitoring
To monitor marine carbon cycling and ocean acidification, scientists collected water samples and measured dissolved inorganic carbon, total alkalinity, pH, and nutrients at 32 stations. Increases in dissolved carbon dioxide can increase acidity of the water, which can in turn affect shellfish and other sensitive organisms. The NOAA Ocean Acidification Program funded this work. It was conducted in partnership with NOAA’s Atlantic Oceanographic and Meteorological Laboratory in Miami.
The crew also collected pteropods, a planktonic shelled mollusk, from the water column. Researchers will examine the condition of the pteropod shells to measure the biological effects of ocean acidification. To facilitate the pteropod sampling alongside carbonate chemistry measurements, we expanded our plankton net tows to include the chemistry stations in the Mid-Atlantic Bight on this cruise. We also took supplemental surface carbonate chemistry samples at any plankton station where we saw pteropods.
We conduct pteropod measurements in partnership with the Bermuda Institute of Ocean Science, where the measurement technique was developed by Dr. Amy Maas.

Special Collection Summary
Our EcoMon program collaborates with other agencies and institutions, supporting research that enhances core EcoMon sampling.
Visual Sighting
Two observers were aboard to watch for and record data on seabirds, marine mammals, and sea turtles we encountered along the cruise track. This is part of the Atlantic Marine Assessment Program for Protected Species. The program is a partnership among scientists from NOAA, the U.S. Fish and Wildlife Service, the Bureau of Ocean Energy Management, and the U.S. Navy.
Phytoplankton Monitoring
We deployed an imaging flow cytobot to image and count phytoplankton cells from surface waters throughout the ship’s transit. This work is part of a National Science Foundation project led by Woods Hole Oceanographic Institution. Collaborators include the University of Massachusetts Dartmouth, the University of Rhode Island, Wellesley College, and NOAA Fisheries. Technical difficulties during the cruise limited the spatial coverage of the IFCB.
Environmental DNA
We collected 299 water samples for environmental DNA metabarcoding analysis from 32 sites ranging from the Mid-Atlantic Bight to the Gulf of Maine. By sequencing DNA left in the water by marine vertebrates, we will be able to tell which fish species were present in a location. Once the technique is developed, eDNA surveys will be cost effective, environmentally friendly, and sensitive to detecting fast, rare, or elusive species.
Community and Primary Production
We took water samples from a subset of depths for analysis of oxygen/argon ratio and triple oxygen isotopes. These gas tracers provide rates of net community production and gross primary production. This work is part of a National Science Foundation project led by Woods Hole Oceanographic Institution. Collaborators include the University of Massachusetts Dartmouth, the University of Rhode Island, Wellesley College, and NOAA Fisheries.
A researcher from the University of Rhode Island used plankton nets to collect subsamples of plankton for stable isotope analysis. The project will examine the spatial distribution of plankton carbon and nitrogen isotopes in the offshore samples and then compare them with results obtained from samples taken from Narragansett Bay and Block Island Sound.
Ocean Forecasting
We deployed a small buoy from SoFar Ocean used for ocean forecasting and ship routing. All of the data the buoy collects is free for academic purposes and use.
Outreach

Prior to the cruise, chief scientist Jerry Prezioso visited Cranston West High School and gave a talk about the upcoming spring Ecomon survey. The students decorated styrofoam coffee cups which we took to sea. We attached them to a sampling array, and repeatedly submerged them to as much as 500 meters depth. The high pressures of deep water crushed air pockets in the styrofoam, making the styrofoam cups shrink. Prezioso returns these shrunken cups to the students as mementos, to demonstrate the effects of water pressure.