Unsupported Browser Detected

Internet Explorer lacks support for the features of this website. For the best experience, please use a modern browser such as Chrome, Firefox, or Edge.

Fisheries of the United States, 2016

October 30, 2017

Each year NOAA Fisheries compiles key fisheries statistics from the previous year into an annual snapshot documenting fishing’s importance to the nation. The 2016 report provides landings totals for both domestic recreational and commercial fisheries by species and allows us to track important indicators such as annual seafood consumption and the productivity of top fishing ports. These statistics provide valuable insights — but to fully understand the overall condition of our fisheries, they must be looked at in combination with other biological, social, and economic factors of ecosystem and ocean health.

FUS2016 image - 750x500.jpg

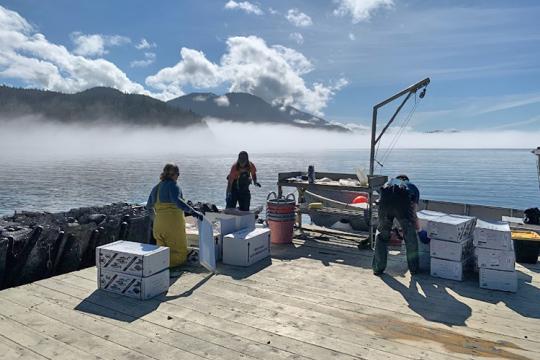
Please see our commercial landings queries for the most up-to-date numbers for landings volume and value.

Infographics

To download the infographics, see the menu to the right with more information.

FUS2016_1_CommFish_Landings&Values_v2.png

2016 U.S. Commercial Fisheries and Seafood Industry, Highlights

FUS2016_2_CommFish_TopPorts_v2.png

2016 U.S. Commercial Fisheries and Seafood Industry, Top Ports by Volume and Value of Seafood Landed

FUS2016_3_CommFish_HowCatchisUsed.png

2016 U.S. Commercial Fisheries and Seafood Industry, How Our Catch is Used

FUS2016_4_CommFish_ProcessedProducts_v2.png

2016 Value of Processed Fishery Products

FUS2016_5_CommFish_TradeEastAsia.png

2016 U.S. Trade with East Asia

FUS2016_6_RecFish_Anglers&Trips_FINAL_v2.png

2016 U.S. Recreational Fisheries, Saltwater Trips and Catch

FUS2016_7_RecFish_TopSpecies.png

2016 U.S. Recreational Fisheries, Top Species by Pounds Harvested

FUS2016_8_AquacultureHighlights.png

2015 U.S. Aquaculture Production, Highlights

Last updated by Office of Science and Technology on April 03, 2019