Even without a pandemic, figuring out the number of eggs a fish will lay during its spawning season is a difficult task. While this information is important to fishery biologists, long-term data are scarce. That hampers researchers ability to answer a fundamental question important for fishery managers: What affects the ability of marine fish, and fish populations, to replace themselves in an open ocean? The pandemic made answering this question even more difficult—but our researchers persevered.

“Many marine fish produce hundreds of thousands to millions of eggs per female per year, the survival of which determines the future abundance of a population,” said Mark Wuenschel, a fish biologist at the Northeast Fisheries Science Center. Wuenschel is leading a long-term study on “fecundity”—a term for reproductive potential—in two commercial flatfish species, winter flounder and yellowtail flounder. “We had to have enough samples, and we had to work out the methodology to do it.”
Annual fecundity — in this case, measured by the number of eggs — varies and depends on the size, age, and condition of the female fish. Environmental variables, such as temperature and available prey, also affect the growth, condition, and reproduction of the females. Like many things in life, timing is everything. To study fecundity, female fish have to be collected at just the right time from the right locations, and in large numbers. Then, lots of eggs need to be counted.

Enter Emilee Tholke and Yvonna Press, both center biologists who work with Wuenschel. They were granted access to their lab one day a week under specific safety protocols. They prepared egg samples and captured images of the eggs using a high-resolution camera with a macro lens and a microscope. Images were stored on a flash drive or transferred to a shared network file.
Then, working from home, each analyzed the images and entered the results into a shared database. Working from home not only kept the egg counts going, but ensured that critical sampling would continue, and prevented a back-log of sample processing work. This year’s effort completes a 10-year time-series of sampling, image analysis, and fecundity estimates for winter and yellowtail flounders.

How Scientists Get to the Eggs
Once collected, all the fish are dissected and a variety of data are collected on each fish:
- Length
- Weight
- Gonad mass
- Age structures (ear stones and scales)
- Liver weight
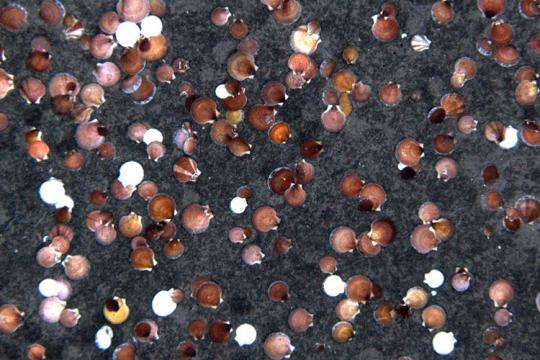
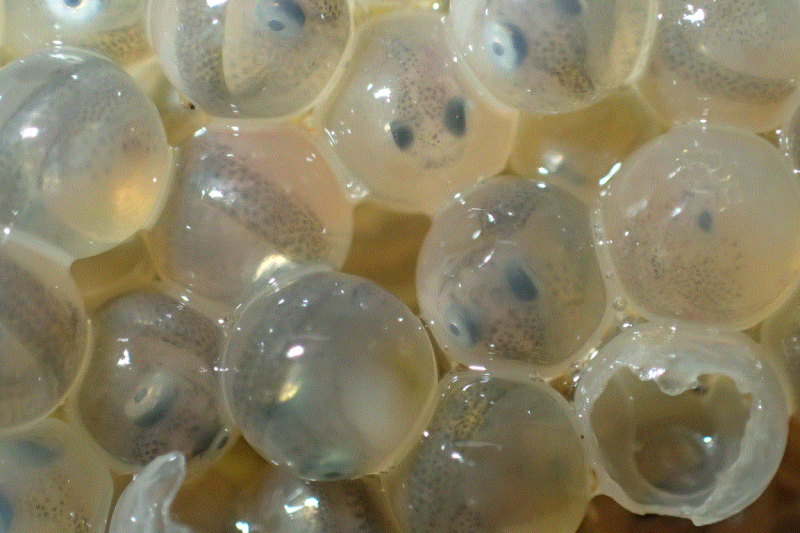
Only fish approaching a spawning condition are used for fecundity estimations. A small sample of the ovary is saved. The oocytes — immature cells before they become eggs — are teased apart from the ovary by hand, one sample fish at a time.
Each oocyte is about the size of a pinhead, with 300 to 600 oocytes appearing in each image. For each individual fish sampled, two or three images of its oocytes are taken. The computer automatically counts the number and measures their diameter in each image. Each image is then checked and verified by humans — in this case, Tholke and Press, working at home.
Commercial Fishermen Collect Needed Samples

Each flounder species studied has three stocks: Southern New England and Mid-Atlantic, Gulf of Maine, and Georges Bank. Both species spawn in winter to spring. All stocks have been in decline in the recent past.
At first, center researchers asked if fecundity varied among the three stocks for each flounder species. They observed different rates of reproductive productivity in multiple years. Among years, there was relatively little variation; however, they had only collected a few years of samples.
The team needed more years of data to show significant variations over time and locations, and continued collecting samples through 2019.
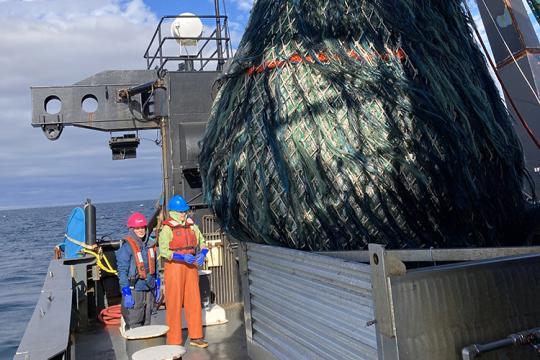
Those samples came from commercial fishermen who participate in the center’s Cooperative Research Program’s Study Fleet, and from the center’s Industry Cooperative Sweep Comparison Study. Supplemental samples were obtained from trawl surveys conducted by the Massachusetts Division of Marine Fisheries and the University of Rhode Island.
With enough focused sampling, researchers can begin to fill in gaps in knowledge about the species’ life histories. We can also address other questions related to stock assessments, such as how environmental factors might influence projected populations.
10-Year Study an Important Advance for Fishery Management
“This is a high-risk, high-reward study with a unique time series, but it is one step in the process,” said Rich McBride, chief of the center's Population Biology Branch. “Fecundity data aren’t typically available for a species because these data are hard to get, and many researchers thought they would find little variation. It wasn’t until the team really got into the years of data they had collected that the variations started showing.”
A recently funded project will use this dataset to explore the links between regional environmental factors and the potential to predict fecundity in these stocks.
“Our data comes from warm and cold years and different locations. Our preliminary analyses suggest regional variations in stocks and year effects,” Wuenschel said. “Further studies may indicate why the fecundity rates vary in relation to local environmental factors, and the importance of variations on the populations.”
For more information, please contact Shelley Dawicki.