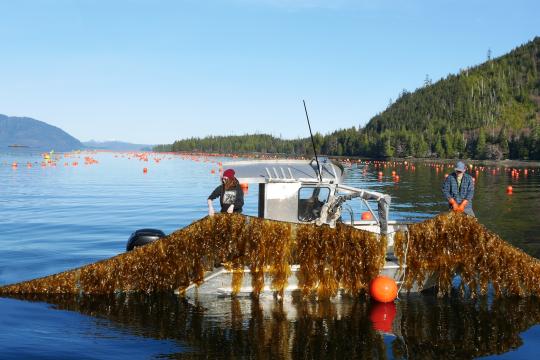
Aim a beam of near-infrared light at an otolith, and it reflects a literal spectrum of information on the biological and environmental history of a fish.
NOAA Fisheries scientists are developing ways to use near-infrared spectroscopy (NIRS) analysis of otoliths (fish ear stones) to provide accurate information for sustainable fisheries management faster. NIRS has already proven its value as a time- and cost-effective method to determine the age of fish.
Now, for the first time, scientists have used NIRS analysis of otoliths to identify fish species and populations. The new technique successfully differentiated 13 marine fish species from four large marine ecosystems around the country.
“Our study shows the potential of NIRS as a fast and reliable method of identifying fish species and populations,” said Irina Benson, Alaska Fisheries Science Center biologist. She led the study with Age and Growth Program colleague Thomas Helser and Beverly Barnett of the Southeast Fisheries Science Center. “This technology could provide information for stock assessment and management faster than traditional methods. It expands the possibilities for collecting data to support ecological studies. It is a big step forward for NOAA Fisheries’ strategic initiative to develop NIRS technology for fisheries science.”
Biography of a Fish
Otoliths are small calcified structures in the inner ear of a fish, also known as ear stones. Otoliths help fish with hearing and balance. Their value to scientists, however, lies within their layers. An otolith grows incrementally over the lifetime of a fish, recording a timeline of information about the fish’s biology and environment.
These layers can be counted visually under a microscope to determine the age of a fish. That is the traditional method for ageing many commercial species to support fisheries management.
Recent developments of more sophisticated and sensitive instruments have allowed scientists to explore the microchemical information contained in otoliths. Trace chemicals reflect water properties and physiological changes the fish experienced throughout its life.From this information scientists can reconstruct a history of the fish’s movements, diet, habitat use, and environmental conditions in addition to its age.

Near-Infrared Spectroscopy
NIRS is widely used in industry and science. For example, in the dairy industry, NIRS is used to determine the butterfat content of milk. In others, such as agriculture and pharmaceuticals, it is used as an efficient, accurate, and non-destructive way to measure product quality. In neuroscience, NIRS is being used to map cognitive brain function.
To determine the age of a fish using NIRS technology, near-infrared light is focused on an otolith. The amount and wavelengths of light absorbed by the otolith are measured and recorded by a machine called a spectrometer. These spectral data reflect the molecular make-up of the otolith, which is correlated with fish age.
Scientists at the Alaska Fisheries Science Center’s Age and Growth Program conducted the first extensive feasibility study using NIRS to age walleye pollock. NIRS age estimation was almost 10 times more efficient than traditional microscope techniques.
It promises a faster, reliable method to meet the growing demand for fish age data. NOAA Fisheries funded a 5-year strategic initiative to develop this technology for use nationwide.

Beyond Ageing: NIRS in Fisheries Science
“The project began with developing NIRS to age fish from different regions around the country,” said Benson. “Now we are exploring new ways to get fish life history information using this technology on samples we are already collecting.”
Recently, scientists have begun to investigate the use of NIRS technology in biodiversity and ecological studies. But only a few studies have looked at applications in fisheries science.
“If we could identify fish species from otoliths using this technology, it could provide essential information for ecological studies,” said Benson. “For example, you could look at diets of marine predators based on NIRS analysis of otoliths in their stomachs. NIRS is much faster than other methods like otolith shape analysis, otolith microstructure analysis, or genetic research. And besides saving time, NIRS does not destroy otoliths like other methods do. It leaves them intact and ready for other analyses.”
Nationwide Collaboration
NOAA Fisheries scientists from across the country worked together to apply NIRS to differentiate fish species, and differentiate the same species from different regions.
“One of the most exciting things about this project was the synergy,” Benson said. “We had so many people from different NOAA Fisheries labs working closely together. Everyone exchanging information and progress. Scientists brought otoliths from their own regions all over the country. It is rare to have access to that.”
“I participated in the NOAA Rotational Assignment Program to work at the Alaska Fisheries Science Center for about 3 months in 2019. During that time I worked closely with Tom and Irina in the Age and Growth lab to scan otoliths using NIRS,” said Barnett. “Funny to admit, but I am always thinking about otoliths and how we can use them to make our science at NOAA Fisheries better. NIRS opens the door to do just that. There are so many unanswered questions about the chemical and molecular constituents in otoliths. This project gave us the opportunity to learn more about these constituents and how they vary among species and across different ecosystems.”
Classifying Fish Species Within Ecosystems
The NIRS analysis distinguished individual species, groups of species from individual ecosystems, and groups from combined ecosystems. It had an overall accuracy of 92 percent, 98 percent, and 100 percent, respectively.
Species Identification and Environmental Influences
The accuracy of species predictions varied depending on where they came from. Most misclassifications happened between:
- Same species from different geographic areas (for example, red snapper in the Gulf of Mexico versus North Atlantic)
- Different species from the same area (walleye pollock, Pacific cod, and yellowfin sole in the Bering Sea)
“These results suggest that habitat, diet, and environmental conditions such as temperature may influence the spectral signature of otoliths,” said Benson. “That suggests that NIRS may prove useful in answering ecological questions. For example, it could help us understand how ocean warming affects food webs.”

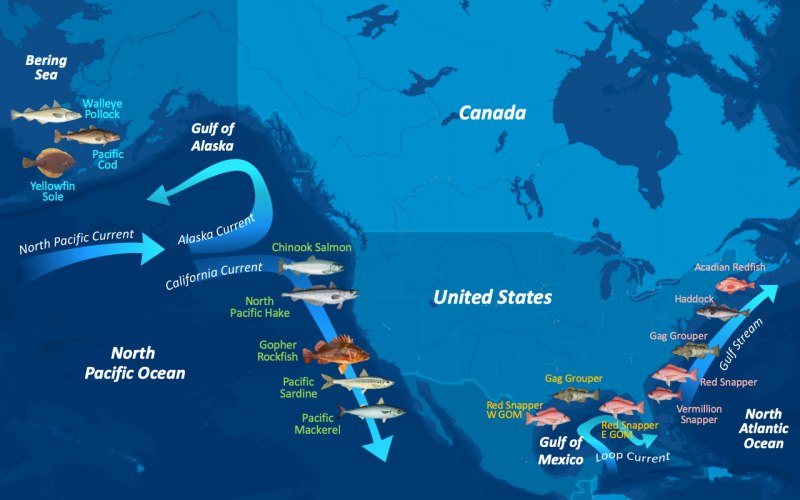
Ecosystems and Oceanography
NIRS discriminated otoliths of all species analyzed from the eastern Bering Sea and North Pacific Ocean large marine ecosystems with 100 percent accuracy. North Atlantic Ocean (97 percent) and Gulf of Mexico (93 percent) ecosystems were slightly more difficult to discriminate.
These results may reflect the oceanography and ecology of each region.
North Pacific Ocean currents split along the U.S. West coast and support different large marine ecosystems in the North Pacific and eastern Bering Sea. Differences between fish otoliths from the two regions may be explained in part by annual sea ice. It has a strong impact on marine chemistry and biology in the eastern Bering Sea, but not on the North Pacific Ocean.
Gulf of Mexico water is transported north along the Atlantic coast of the United States by the Gulf Stream. Around Cape Hatteras, the Gulf Stream swings away from the coast. There it creates a boundary between the Gulf of Mexico and North Atlantic Ocean ecosystems. Fish and fauna are known to move across in both directions.

Future Research
The success of this pilot project promises many future possibilities for NIRS analysis of otoliths. Benson describes a few paths for further exploration:
- See if NIRS can differentiate fish species that are of similar appearance and difficult to identify taxonomically.
- Take this technology out to sea on fishing boats and research cruises to provide immediate, real-time data for stock assessment and management.
- Look into how water temperature or other changes in water chemistry associated with climate change influences the NIR signature of otoliths.
- Create a library of NIRS signatures to identify otoliths from the stomachs of marine predators for food web studies.
“We are just beginning to discover the benefits of using this technology in fisheries science,” said Benson. “As we continue to learn how to use NIRS to read the information stored in otoliths, we will be able to answer more fisheries questions more quickly. It can help us better understand the big ecological picture.”
This research was funded by NOAA Fisheries’ FT-NIR Spectroscopy Age Estimation Strategic Initiative.