Who hasn’t looked out at the ocean and wondered where the waves and currents would take them, or walked along the beach in hopes to find a message in a bottle? Over the years, NOAA scientists have studied and mapped the ocean’s currents and features to help answer questions about fish migrations, larval transport, and how nutrients are carried through the water.
The ocean is not a big, uniform bowl of water. It has rivers of different density water flowing through it and ever changing, and spinning pools of water that trap nutrients and plankton in their currents. In order to understand how these features affect marine animals, we must first be able to map them. Take a quick tour with us and learn how our scientists started mapping ocean features by making visual observations, throwing bottles out of planes, measuring temperatures from space, and tracking waves with radar.
Early Mapping

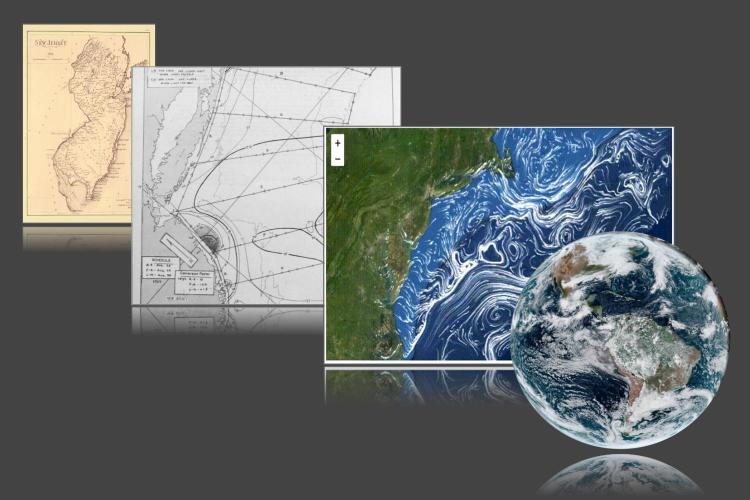
Early mapping of ocean dynamics was done by ships at sea and through land-based observations. Tidal observations and coastal sand deposits gave early indications of the continuously moving ocean environment. Before aerial photographs, GPS positioning, and computer printing, scientists relied on hand-drawn maps and what they could see to research the forces that influence the movement of marine animals.
Advances in the 1960s

In the 1960s, advances in physics and aviation led to an exciting new method of ocean feature observation. Scientists from the Northeast Fisheries Science Center’s Sandy Hook Laboratory in New Jersey flew aerial surveys aboard a U.S. Coast Guard Albatross aircraft. They used infrared radiation thermography to map sea-surface temperatures. Infrared radiation thermography is a method of detecting radiant heat emissions—in this case from the ocean—and converting those readings to temperatures. A Varian Associates strip-chart recorder printed the sea-surface temperatures captured by the infrared radiometry thermometer. Sea-surface temperatures collected on these monthly flights could then be associated with aerial sighting and other records of aquatic organisms along the Atlantic continental shelf.

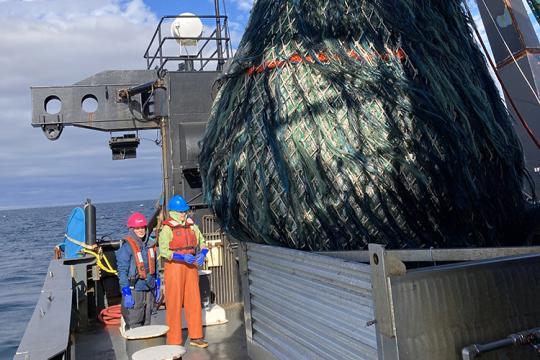
By 1969, researchers had recorded more than 10,000 observations of fish, turtles, and marine mammals, in addition to thousands of transect miles of surface temperature. They had released more than 70,000 drift bottles and sea bed drifters. These photographs were likely taken aboard the Grumman UF-1G Albatross, an amphibious U.S. Coast Guard plane. This plane was the primary aircraft model used in the Sandy Hook Laboratory’s monthly infrared radiometry aerial surveys.
People, Collaboration, and Shared Networks

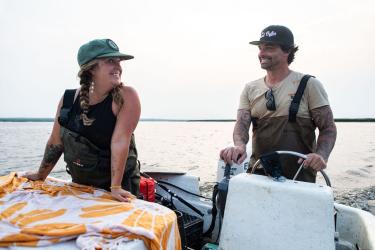
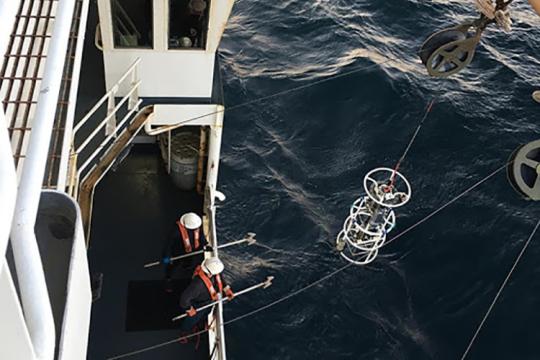
Advances in the field of ocean feature mapping aren’t just the result of new equipment and instruments. People and collaborative projects have increased our understanding of ocean dynamics. Consortia of government, academic, and industry scientists have created shared networks of oceanographic data. Scientists from the Northeast Fisheries Science Center relied on data from Rutgers University’s high-frequency radar array to identify current circulation patterns that influence fish movements. Fishermen and students have built and deployed GPS-enabled drifters, and center scientists have made these data available to the public.
Big Data and Powerful Computer Models

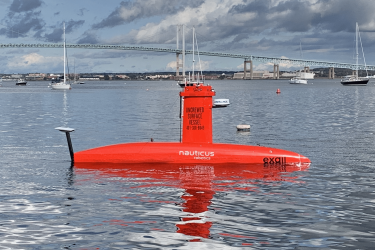
Today, scientists use the power of community science, satellites in orbit, GPS drifters and powerful, computerized ocean models. They have a much greater understanding of the dynamics of our oceans than the early days of hand-drawn maps and at-sea observations. This wealth of data can be used to better understand fish movements, the development of algal blooms, and the changes to the ecosystem. It is exciting to think what the next 150 years of ocean technology and research will bring.
For more information, please contact Jeff Pessutti