If you want to protect a species, you have to know where it is. That can be difficult in the ocean, where animals are often hidden beneath the waves. To find out where ocean animals go and the routes they take to get there, scientists attach electronic tags to them. Those tags collect data on temperature, depth, and location, then transmit their data via satellite.
Jeffrey Polovina is a scientist with NOAA’s Pacific Islands Fisheries Science Center in Honolulu, and he and his colleagues have tagged hundreds of loggerhead sea turtles, bigeye tuna, swordfish, moonfish, and whale sharks. “The tags allow us to see tracks in the ocean,” Polovina said, “but we’re also interested in the bigger picture.”
As Polovina explains in this interview, the bigger picture comes from combining tag data with data from ocean-observing satellites. That oceanographic data shows large-scale features in the ocean such as currents, fronts, and eddies. The tracking data from the tags show how animals navigate through and around these features.
Your research involves combining tag data with data from ocean-observing satellites. What do you learn by doing this?
We look out on the ocean and see this homogenous expanse. But animals see it very differently, and that’s why it’s useful to send fleets of animals out with tags on them. By combining tag data with oceanographic data, we get to see how animals perceive the ocean, and that provides some amazing insights.
It’s clear that these animals aren’t just wandering randomly over the ocean. They’re following well-defined paths. Sometimes they'll get into an eddy, which is a big circulation pattern that can be 100 km across, and they'll ride around the edge, maybe once or twice, each time taking maybe a month to go around. And then they'll get off right where they got on, and continue on their way. They get pushed around by strong currents, but then they’ll travel back to resume their trajectory. They're able to stay within different features of the ocean, something that for a ship would require GPS and satellite imagery. You get a sense that these animals not only know where they are but they know where they’re going in this big ocean.

The tracks of a loggerhead sea turtle that spent four months traveling the edge of an eddy in the Pacific Ocean (A is Oct 2003, B Nov 2003, C Dec 2003, and D Jan 2004). Currents and sea surface height are shown as background. Maps: Jeffrey Polovina et al. 2006. The Kuroshio Extension. Deepsea Res.II (53)326-339.
What was the biggest surprise you’ve had upon downloading data from an electronic tag?
Loggerhead sea turtles showed us a new aspect of the ocean that we didn’t expect. The loggerheads we tagged nest on beaches in Japan, and they also turn up off the Baja Peninsula in Mexico. So we assumed that after hatching they swam across the Pacific to Mexico. We tagged about 400 loggerheads, and we found that quite a number of them spend years and even decades in the open ocean far from shore, migrating back and forth along a well-defined oceanographic front.
That front separates a nutrient-rich mass of water to the north from nutrient-poor waters to the south, and the turtles were moving back and forth across that boundary. People had studied these regions before, but until the turtles showed us that it was important, no one had paid attention to the boundary between them, which stretches most of the way across the Pacific Ocean. So they showed us an important feature of the ocean that we didn’t know was out there.

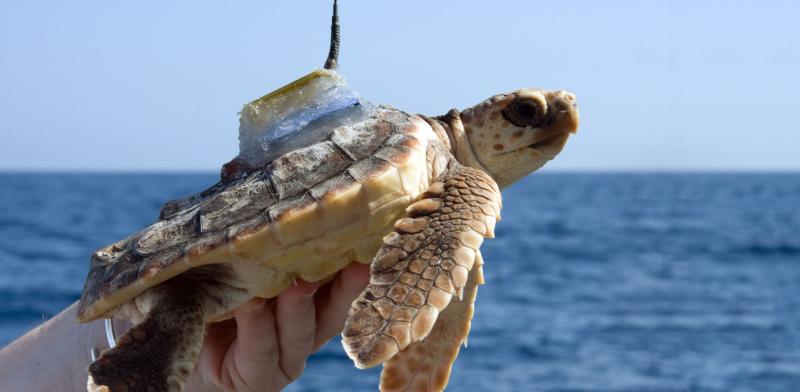
Fishermen in Fiji help Jeffrey Polovina (front right) carry a loggerhead sea turtle that is about to be outfitted with a satellite tag. This tagged turtle will help scientists identify habitats and migration routes that are important to loggerhead sea turtles. Photo: NOAA Fisheries
What was the most challenging tagging situation you’ve encountered?
Each animal has its peculiar challenges and problems. We’ve tagged moonfish—they’re also known as opah—which are these big, slow-swimming, deep-diving animals. We were getting a lot of data from opah that showed standard dive distributions of 300 to 400 meters depth.
Then after a couple weeks one of the tags started showing completely different behavior. They were going deeper, the water temperature was much warmer, and the light sensors recorded total darkness. [Editor’s note: data from the light sensors are used to calculate location, since GPS doesn’t work underwater.]
We thought the tag had malfunctioned and sent it back to the manufacturer. But it turned out that a shark ate the tag, and maybe the opah with it. The tag was in the stomach of an endothermic shark, so it was warmer than the ambient water temperature, and of course it was totally dark. After a couple of weeks in the shark it came out one way or another, popped up to the surface, and we got tracks of two different species from the same tag.

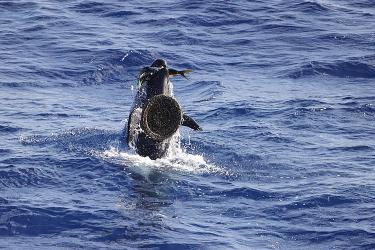
An opah, a.k.a moonfish. Photo: NOAA Fisheries
So the tags are also collecting information on the animals’ diving behavior. What are we learning about the three-dimensional aspect of the ocean from tagging data?
It seems that every time we put a tag on an animal, it’s diving a lot deeper than we had previously imagined. For instance, we used to think that whale sharks mainly used the shallow surface layer of the ocean. But our tagging showed that they often dive to at least 980 meters. We don't really know how deep they’re going—the tags only register up to 980 meters. They might be going a lot deeper.
These deep dives are a puzzle. It may be that they’re finding prey organisms at those depths. Maybe they go there to escape from predators, or maybe they’re just going down there to cool off after building up heat at the surface layer.
We’ve also seen swordfish in the Central Pacific going down to 800 meters and feeding all day in that cold dark water and then coming up at night to warm up. Bigeye tuna shoot down to around 300 meters, but they only stay for an hour or two then shoot back up to warm up and oxygenate.
Different species seem to be partitioning the vertical depth structure in the ocean, each foraging on different species in a different depth range, so that they're not all at the same depth competing for the same resources.

A whale shark. Photo: Wikimedia
What’s the next step for tagging research?
Longer-lasting tags so we can collect multi-year data and smaller tags so we can tag smaller animals. For example, longer-lasting tags would allow us to analyze how the movements and habitats of equatorial tuna change between El Niño and La Niña conditions. Smaller tags would allow us to learn about movements of hatchling sea turtles.
We’re also looking forward to tags with new types of sensors. Currently most tags just provide temperature, depth, and some measure of location. Tag sensors that provide swimming velocity, or that take physiological readings such as heartbeat for bioenergetic models or stomach temperature to indicate prey ingestion will allow us to ask a lot of interesting questions.