| Date of Closure and Map | Area (sq mi) | Area (sq km) | Percent Coverage of Gulf EEZ |
Percent Change in Coverage |
|
| 2010 | May 2 | 6,817 | 17,648 | 2.8 | N/A |
| May 7 | 10,807 | 27,989 | 4.5 | 58.5 | |
| May 11 | 16,027 | 41,511 | 6.6 | 48.3 | |
| May 12 | 17,651 | 45,717 | 7.3 | 10.1 | |
| May 14 | 19,377 | 50,187 | 8.0 | 9.8 | |
| May 17 | 24,241 | 62,784 | 10.0 | 25.1 | |
| May 18 | 45,728 | 118,435 | 18.9 | 88.6 | |
| May 21 | 48,005 | 124,333 | 19.8 | 5.0 | |
| May 25 | 54,096 | 140,109 | 22.4 | 12.7 | |
| May 28 | 60,683 | 157,169 | 25.1 | 12.2 | |
| May 31 | 61,854 | 160,200 | 25.6 | 1.9 | |
| June 1 | 75,920 | 196,633 | 31.4 | 22.7 | |
| June 2 | 88,522 | 229,270 | 36.6 | 16.6 | |
| June 4 | 78,182 | 202,491 | 32.3 | -11.7 | |
| June 5 | 78,603 | 203,582 | 32.5 | 0.5 | |
| June 7 | 78,264 | 202,703 | 32.3 | -0.4 | |
| June 16 | 80,806 | 209,286 | 33.4 | 3.2 | |
| June 21 | 86,985 | 225,290 | 35.9 | 7.6 | |
| June 23 | 78,597 | 203,564 | 32.5 | -9.6 | |
| June 28 | 80,228 | 207,790 | 33.2 | 2.1 | |
| July 4 | 81,181 | 210,259 | 33.5 | 1.2 | |
| July 12 | 84,101 | 217,821 | 34.8 | 3.6 | |
| July 13 | 83,927 | 217,371 | 34.7 | -0.2 | |
| July 22 | 57,539 | 149,026 | 23.8 | -31.4 | |
| August 10 | 52,395 | 135,703 | 21.7 | -8.9 | |
| August 27 | 48,114 | 124,614 | 19.9 | -8.2 | |
| September 2 | 43,000 | 111,369 | 17.8 | -10.6 | |
| September 3 | 39,885 | 103,303 | 16.5 | -7.2 | |
| September 21 | 31,915 | 82,659 | 13.2 | -20.0 | |
| October 1 | 26,287 | 68,083 | 10.9 | -17.6 | |
| October 5 | 23,360 | 60,502 | 9.7 | -11.1 | |
| October 15 | 16,481 | 42,686 | 6.8 | -29.4 | |
| October 22 | 9,444 | 24,461 | 3.9 | -42.7 | |
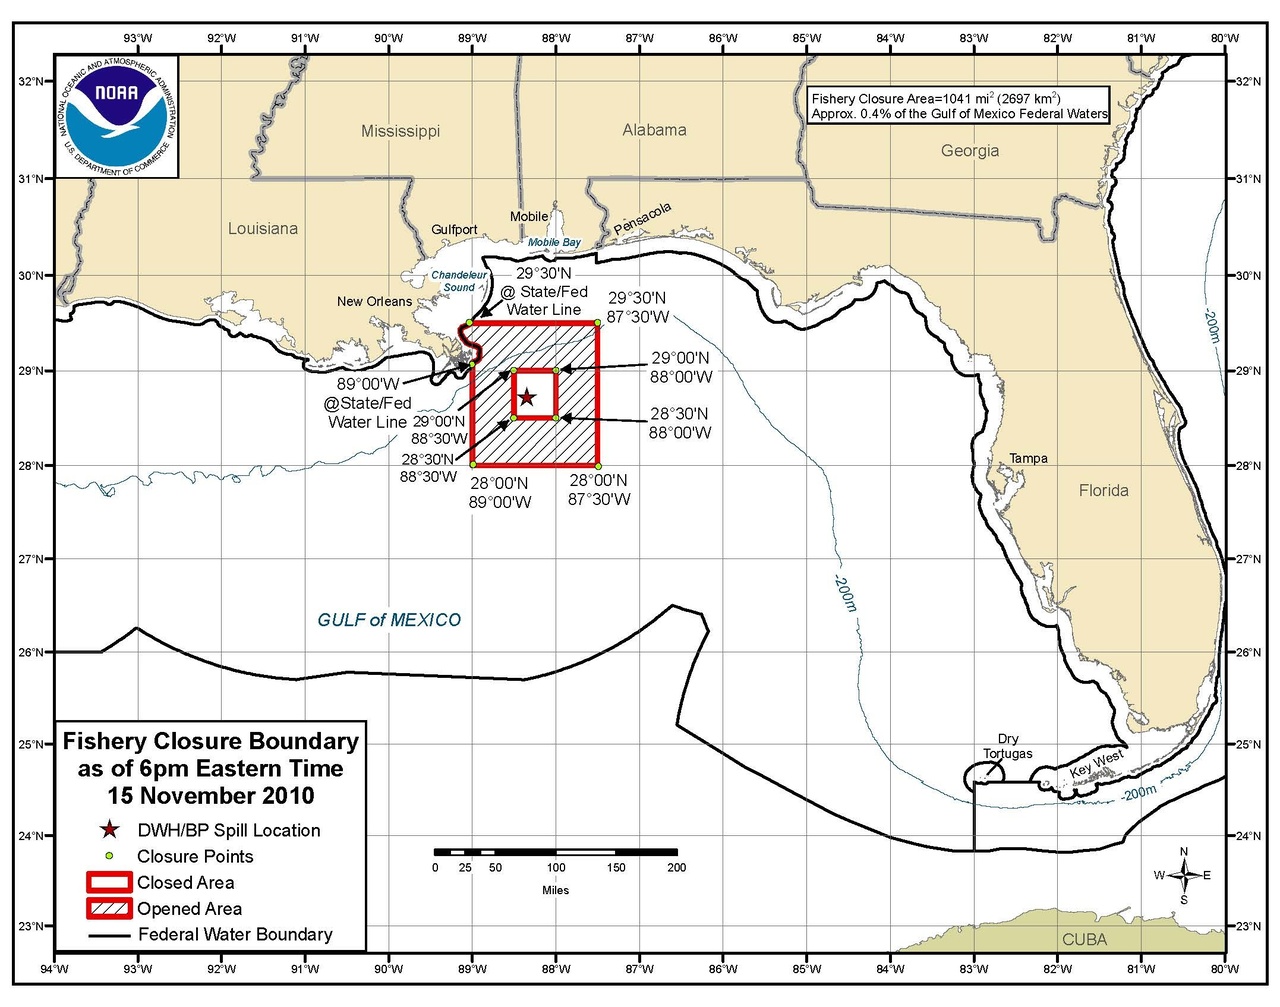
| November 15 | 1,041 | 2,697 | 0.4 | -89.0 |


