Scientists at the Northeast Fisheries Science Center have created a new data mapping tool to help people understand when and where large whales occur off the East Coast.
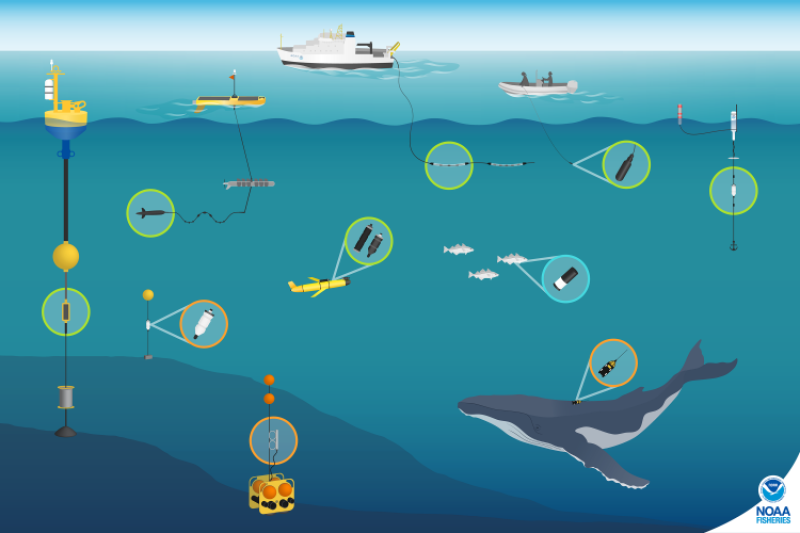
The underlying data include detections made by underwater listening devices — called hydrophones — operated from stationary platforms, such as bottom-mounted moorings and surface buoys. They were also made by mobile platforms like Slocum gliders and towed hydrophone arrays. The map includes sounds made by sei, fin, blue, humpback and North Atlantic right whales from 2004 to the present.
“Our goal was to provide all the archived data we have, plus data from collaborators, in one place and make it easy for managers, stakeholders and scientists to access it themselves and explore the data in a format that would be helpful,” said Sofie Van Parijs, one of the creators and lead of the center’s passive acoustics research group. “We hope to add in data collected by the wind industry, and invite other researchers and sources of this type of data to share what they have with us to make this dataset as comprehensive as possible.”
Those interested in contributing to the data can contact the developers at nmfs.pacmdata@noaa.gov.
Recent additions to the dataset include all beaked whales, sperm whales, and dwarf and pygmy sperm whales (Kogia species) detected from 2013 to the present. Current recording locations range from the waters of the western North Atlantic, off Greenland, to the Caribbean Sea.
Data about each detection is incorporated into the mapping tool, including:
- Location
- Season
- Number of deployments of that recording gear
- Number of recorded days and detections
- Type of detection: definite, possible, no detection, or data collected but not yet analyzed.

To pull up information about a detection, users hover over a point on the map with their mouse or tap the point on a smart device screen. Details appear about that specific deployment, such as the type of recorder, water depth, duration it was deployed, and the project involved. The web-based tool is mobile-friendly, and can be accessed with smart devices such as phones and tablets.
The large baleen whale detections contain contributions from 33 collaborators to date in the United States and Canada. Soon, the map will expand to include minke whales and dolphin species. Creators Van Parijs, Genevieve Davis, and Annamaria DeAngelis of our science center worked with data visualization expert Jeff Walker of Walker Environmental Research Ltd on the project.
This data map for passive acoustic detections is the second such tool for tracking whales off the U.S. East Coast and Atlantic Canada. WhaleMap, maintained by Dalhousie University, displays data from a variety of resources and partners. It includes both acoustic detections and visual sightings. It can also overlay management areas and wind energy development areas onto the charts it generates.


