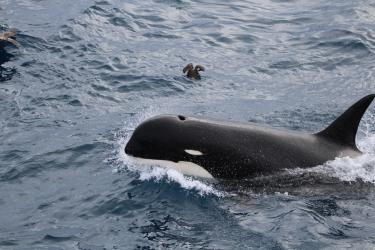
The Ecosystems Monitoring Survey (#EcoMonSurvey) is a seasonal shelf-wide survey that collects environmental and plankton data from the Gulf of Maine to North Carolina. Data from the survey are used by scientists and stakeholders in our region and internationally. Applications range from estimating fish spawning stock biomass and biodiversity, to monitoring changes in the physical marine environment and estimating food available for marine mammals, fish, and seabirds. Long-term monitoring surveys such as EcoMon are like routine blood-pressure checks you get at the doctor’s office. We’re keeping our fingers on the pulse, tracking our region’s marine heartbeat.
1. #EcoMonSurvey: Mission Possible!
Between 1912 and 1970, exploratory and short-term surveys to collect plankton and oceanographic data was carried out by the Bureau of Commercial Fisheries, predecessor to NOAA Fisheries. In 1977, the Northeast Fisheries Science Center began a more strategic and standardized sampling effort called Marine Resources Monitoring Assessment and Prediction (MARMAP) Program. Later, in 1992, it evolved into today’s program. Its mission:
- Monitor the pelagic ecosystem along the Northeast US Shelf from the Gulf of Maine to Cape Hatteras, North Carolina.
- Provide data to stakeholders.
- Provide cruise time to collaborators within NOAA and to other academic researchers outside NOAA.
2. Conductivity, Temperature, and Depth — Oh My!
CTD refers to the electronic instruments that measure Conductivity (used to estimate salinity), Temperature, and Depth in the water column. EcoMon uses a carousel frame outfitted with a CTD and other oceanographic sensors to measure temperature, salinity, dissolved oxygen, fluorescence, and light. The frame also has a series of bottles for collecting water from multiple depths. These samples can be analyzed for nutrients, chlorophyll, and ocean acidification monitoring.
3. If Plankton Stations Were Seats at Fenway Park, We’d Fill about 75% of the Stadium!
We've sampled more than 28,000 stations during various plankton sampling programs since 1971. That’s more than 45 years' worth of data!

4. Wildly Weird
One of the weirdest sightings during an #EcoMonSurvey was when a 6-inch sea lamprey attached itself to our CTD instrument. Sea lampreys can grow to be almost 50 inches, are scaleless, have a pair of functional eyes, and a rather large oral ‘sucker’ for a mouth. That round disk-like sucker is filled with lots of small teeth arranged in circular rows. Read about this wildly weird event in this 2017 blog.
5. By the Numbers
In 2018, the #EcoMonSurvey collected 183 ocean acidification samples, 369 nutrient samples, and 1123 plankton samples.
6. Not Your Typical Carousel Ride

In 2018, the #EcoMonSurvey collected 885 vertical CTD profiles. At CTD only stations, the ship's hydraulic winch lowers the carousel frame to within 5 meters of the ocean bottom and then is brought slowly back up to the surface. As it comes back to the surface of the water, the CTD measures temperature, conductivity and water pressure up to 24 times per second.
Vertical profile graphics can be generated with CTD data. For example, the graphic to the right has a blue line and a brown line. The blue line shows the water column temperature at an EcoMon station located about 20 miles east of Cape Elizabeth, Maine. The brown line is a station about 60 miles east of Atlantic City, New Jersey. The Maine station (blue) has a relatively simple temperature profile with the warmer water nearest the surface separated from the colder water by a thermocline — transition layer between the warmer mixed water at the surface and the cooler deep water below. The New Jersey station (brown) shows a more dynamic and complex profile with a cooler water layer seen between about 20 and 50 meters. This kind of profile happens when currents bring together multiple water sources with different salinity and temperature fingerprints.
7. Going the Distance
If you add up the total height of all the temperature and salinity profiles our #EcoMonSurvey performed during 2018, it comes to 125,097 meters. That's almost 78 miles!
8. Tackling Taxa

The #EcoMonSurvey has been collecting zooplankton since 1992 and ichthyoplankton since 1999. In that time, we've collected 266 zooplankton taxa — species or groupings of species. So far we’ve identified 63 genera and 42 species of zooplankton. For ichthyoplankton (fish eggs and larvae), we’ve collected 466 taxa, 277 genera and 201 species. You might be asking why don’t these numbers add up. That’s because some genera only have one species assigned to it while others can have several species assigned to it. For example, the common zooplankton genus Calanus has 17 species assigned to it, while the fish cobia (Rachycentron canadum) only has canadum assigned to the genus Rachycentron.
9. They Had Us at Bacon
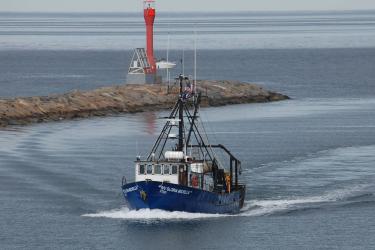
During an average #EcoMonSurvey, NOAA ship Henry B. Bigelow chefs stock about 45lbs of bacon, 45-60 dozen eggs, and 100lbs of potatoes to feed the scientific staff and crew. What are the most popular recipes? Bigelow chefs say smoked pulled pork and beef brisket, and for dessert cheesecake. Read more about how the stewards on the Bigelow create community for the scientists and crew in this 2019 EcoMon blog.
For more information, please contact Heather Soulen.