Recreational fishing is one of the great American pastimes—fostering connections to nature, family, and friends. It’s also a national economic driver, supporting 700,000 jobs and generating $138 billion in sales.
Experts at NOAA Fisheries’ regional science centers, in consultation with states and regional partners and through a public process, perform stock assessments. These assessments determine species’ abundance and health to inform subsequent fisheries management plans. They assure our shared fisheries resources remain productive, sustainable, and economically viable.
“Stock assessment analyses help safeguard both the fisheries stock and any communities that rely on access to those stocks,” said Dr. Matthew Nuttall, NOAA Fisheries’ Southeast Fisheries Science Center fish biologist. “Stock assessments form the foundation upon which regional management decisions are based, including the setting of annual catch limits and any other regulations, such as catch size limits and bag limits, designed to prevent overfishing.”
Stock assessors review a wide range of data to help determine stock status. This includes private boat, shore, and for-hire saltwater recreational fishing catch and effort information. These data are compiled through large-scale surveys that are part of the state-regional-federal recreational fishing data collection partnership known as the Marine Recreational Information Program (MRIP). Using these data, we have been producing recreational fishing catch and effort estimates since the early 1980s.
“MRIP’s value lies in its ability to generate long-term recreational fishing time series across a wide range of fish species,” said Dr. Katherine Papacostas, MRIP program manager. “These data help us understand changes in fisheries and fish stocks over time. The program not only delivers critical catch estimates directly through NOAA Fisheries, but also provides funding and statistical expertise to support our state partners, whose survey data are also essential to science-based fisheries management.”
Our scientists assess the recreational fishing catch and effort information collected through the MRIP partnership alongside commercial catch and biological fisheries data. This provides the scientific foundation for sustainable fisheries management and to fulfill mandates under the Magnuson-Stevens Act.
All of these datasets are plugged into a statistical stock assessment model that determines a stock’s current and future population size and if it is:
- Overfished (the population is too low)
- Undergoing overfishing (the catch rate is too high)
Stock Assessors Rely on Recreational Fishing Survey Data
Atlantic Coast
For many states along the Atlantic Coast, we are the sole provider of recreational catch and effort, or fishing trip, estimates. Scientists depend on these data to perform stock assessments, especially for fisheries with large recreational fishing components. This includes bluefish—an important recreational species along the Atlantic Coast.
Approximately 90 percent of the data used in the bluefish stock assessment come from MRIP.
“Without MRIP data, we wouldn’t be able to conduct this assessment,” said Brian Linton, research fishery biologist with the NOAA Fisheries’ Northeast Fisheries Science Center.
Similarly, total harvest from the recreational fishing sector is around 90 percent or above for striped bass, spotted seatrout, black drum, tautog, cobia, and red drum. These species are managed or co-managed by the Atlantic States Marine Fisheries Commission.
“Without the data we get from MRIP, we have no other way to measure total catch for species with large recreational fishing components,” said Dr. Katie Drew, Commission stock assessment team lead. “These data help us get a good grasp of the scale of the population for these species, as well as the impact fishing activity is having on the population. Length data captured from MRIP also helps us determine the age composition of the recreational catch and how it has changed over time, which can tell us a lot about the health of the population.”
Southeast Coast and Gulf of America
“The historical length information collected through MRIP catch surveys is often one of the most informative datasets in estimating unfished stock productivity and predicting how the stock may react to various levels of fishing activity,” said Nuttall. This is because there are very few biological fisheries surveys extending back into the 1980s in the Southeast region of the United States.
“The basic data required by most stock assessment approaches are catch data, of which MRIP is fundamental,” said Nuttall. “These data are needed to quantify removals from a fisheries stock, to set appropriate catch advice, and to evaluate the relative removals across states and whether removed from shore, private boat, or for-hire boat. MRIP data can also show trends over time of the abundance and availability of individual fisheries stocks, which can be key indicators of when removals may be having undesirable effects on a fisheries population.”
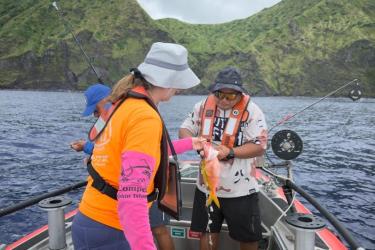
Hawaiʻi
In Hawaiʻi, 20 years of MRIP recreational data have been feeding their stock assessment models for key species like uku (green jobfish) and the “Deep 7” complex. The Deep 7 are considered the most culturally important and highly valued of the deep-water bottomfish species in Hawaiʻi. To supplement our surveys, we are working with Hawaiʻi and the U.S. Pacific territories to design and certify state and territorial-led roving creel recreational fishing surveys.
Capturing Data Limitations and Uncertainty in Assessments
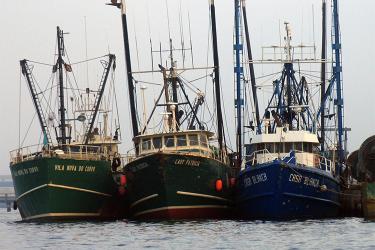
Commercial fishers are required to report their catch, and seafood dealers are also required to report purchases. However, similar census-based approaches that capture all recreational fishing catch and trips are not feasible due to the sheer size and activity of the recreational fishing community. We use large-scale sample surveys to estimate recreational fishing effort and total catch from for-hire captains and private anglers.
The more survey responses received, typically the more precise the resulting catch estimates. However, some species are rare-event or pulse fisheries. This makes it harder to obtain quality data since anglers with these catches are less likely to be interviewed at the docks. Moreover, data limitations or gaps can occur due to insufficient funding for programs like biological sampling.
These limitations are addressed in several ways.
Different models are developed and used depending on the quantity and quality of all available data for the stock assessment. In addition, similar to the Deep 7 in Hawaiʻi, certain species can be assessed as part of a complex if there isn’t enough available data to support assessments for individual species.
“We try to use all data sources to develop a coherent picture of the fishery,” said Drew.
Uncertainty for all data sources is directly captured in the model.
“All of our catch and effort estimates are published alongside their percent standard error,” said Papacostas. “These values help stock assessors and fisheries managers determine how suitable they are for use in assessments and management decisions.”
The higher an estimate’s percent standard error, the more variation in the survey responses received, which means there is more uncertainty in the estimate. These uncertainty estimates can be loaded into the model and weighed as part of the stock status determination.
“With these uncertainty values directly input into the models, the model adapts to determine how hard it should work to try to fit recreational fishing survey data as opposed to other sources of data,” said Drew. “This uncertainty is carried through to the final assessment results and gives us a better understanding of how confident we can be in the results and how likely it is that a stock is overfished or experiencing overfishing.”
Stock Assessment Schedules
Every region has their own process for scheduling assessments. The time it takes to complete an assessment depends on the type of assessment, species being assessed, and quality of data in hand to inform the assessment.
Most species in the Mid-Atlantic and New England regions are assessed on a 2-year cycle. In Hawaiʻi, the cycle for most island species is 3 years. With sufficient data, the more common management track assessments may only take 1 year to complete as existing data are run through a previously developed peer-reviewed model.
More comprehensive research (or benchmark) tracks are also performed but less frequently. These are scheduled through a joint decision by regional NOAA Fisheries offices, science centers, regional marine fishery commissions, and regional fishery management councils. During a research track, scientists reanalyze existing data and incorporate new data to develop a more suitable, robust stock assessment model that must pass a peer review.
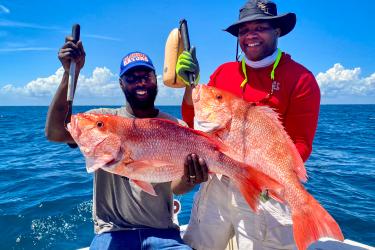
“The decision on when to reassess a fisheries stock is largely based on the importance of that stock in the region; any perceived changes in the health or availability of that stock; and regional resource capacity,” said Nuttall. “For regionally important species in the southeast like red snapper, a new assessment may be requested approximately every 5 years. Conversely, a decade may pass before an assessment is conducted on other stocks. These decisions are collaborative to ensure the needs of the region are being met.”
An Open, Transparent Process
The stock assessment process is open and transparent and incorporates information from anglers and partners.
Stock assessments rely heavily on quantitative federal and state survey data. However, council and commission advisory panels, which include representation from commercial and recreational anglers, provide qualitative statements. These are considered as part of the stock assessment process. These statements include direct on-the-water observations of fisheries. Similarly, council and commission members provide information related to fisheries stock management history.
“This additional information provides important context and historical background that helps us interpret assessment model results,” said Linton.
Your Fishing Data Make a Difference
“The recreational fishing surveys rely on angler participation,” said Linton. “By participating in these surveys when requested, anglers play a critical role in helping to ensure that the data used in our assessments accurately represent the recreational fishery.”
With the help of MRIP data and angler support, 50 fisheries stocks have been rebuilt since 2000—assuring access to these resources for work and play.
In the Pacific Islands, however, fishing is more than work or play. It is central to the way of life.
“Information from stock assessments helps guarantee food security and local economic benefits without endangering or crashing fisheries in the long term,” said Marc Nadon, a stock assessment scientist with the NOAA Fisheries Pacific Islands Fisheries Science Center. “Sustenance fishing is a big deal for a lot of the coastal stocks here; it is fundamental to the Pacific Islander culture.”