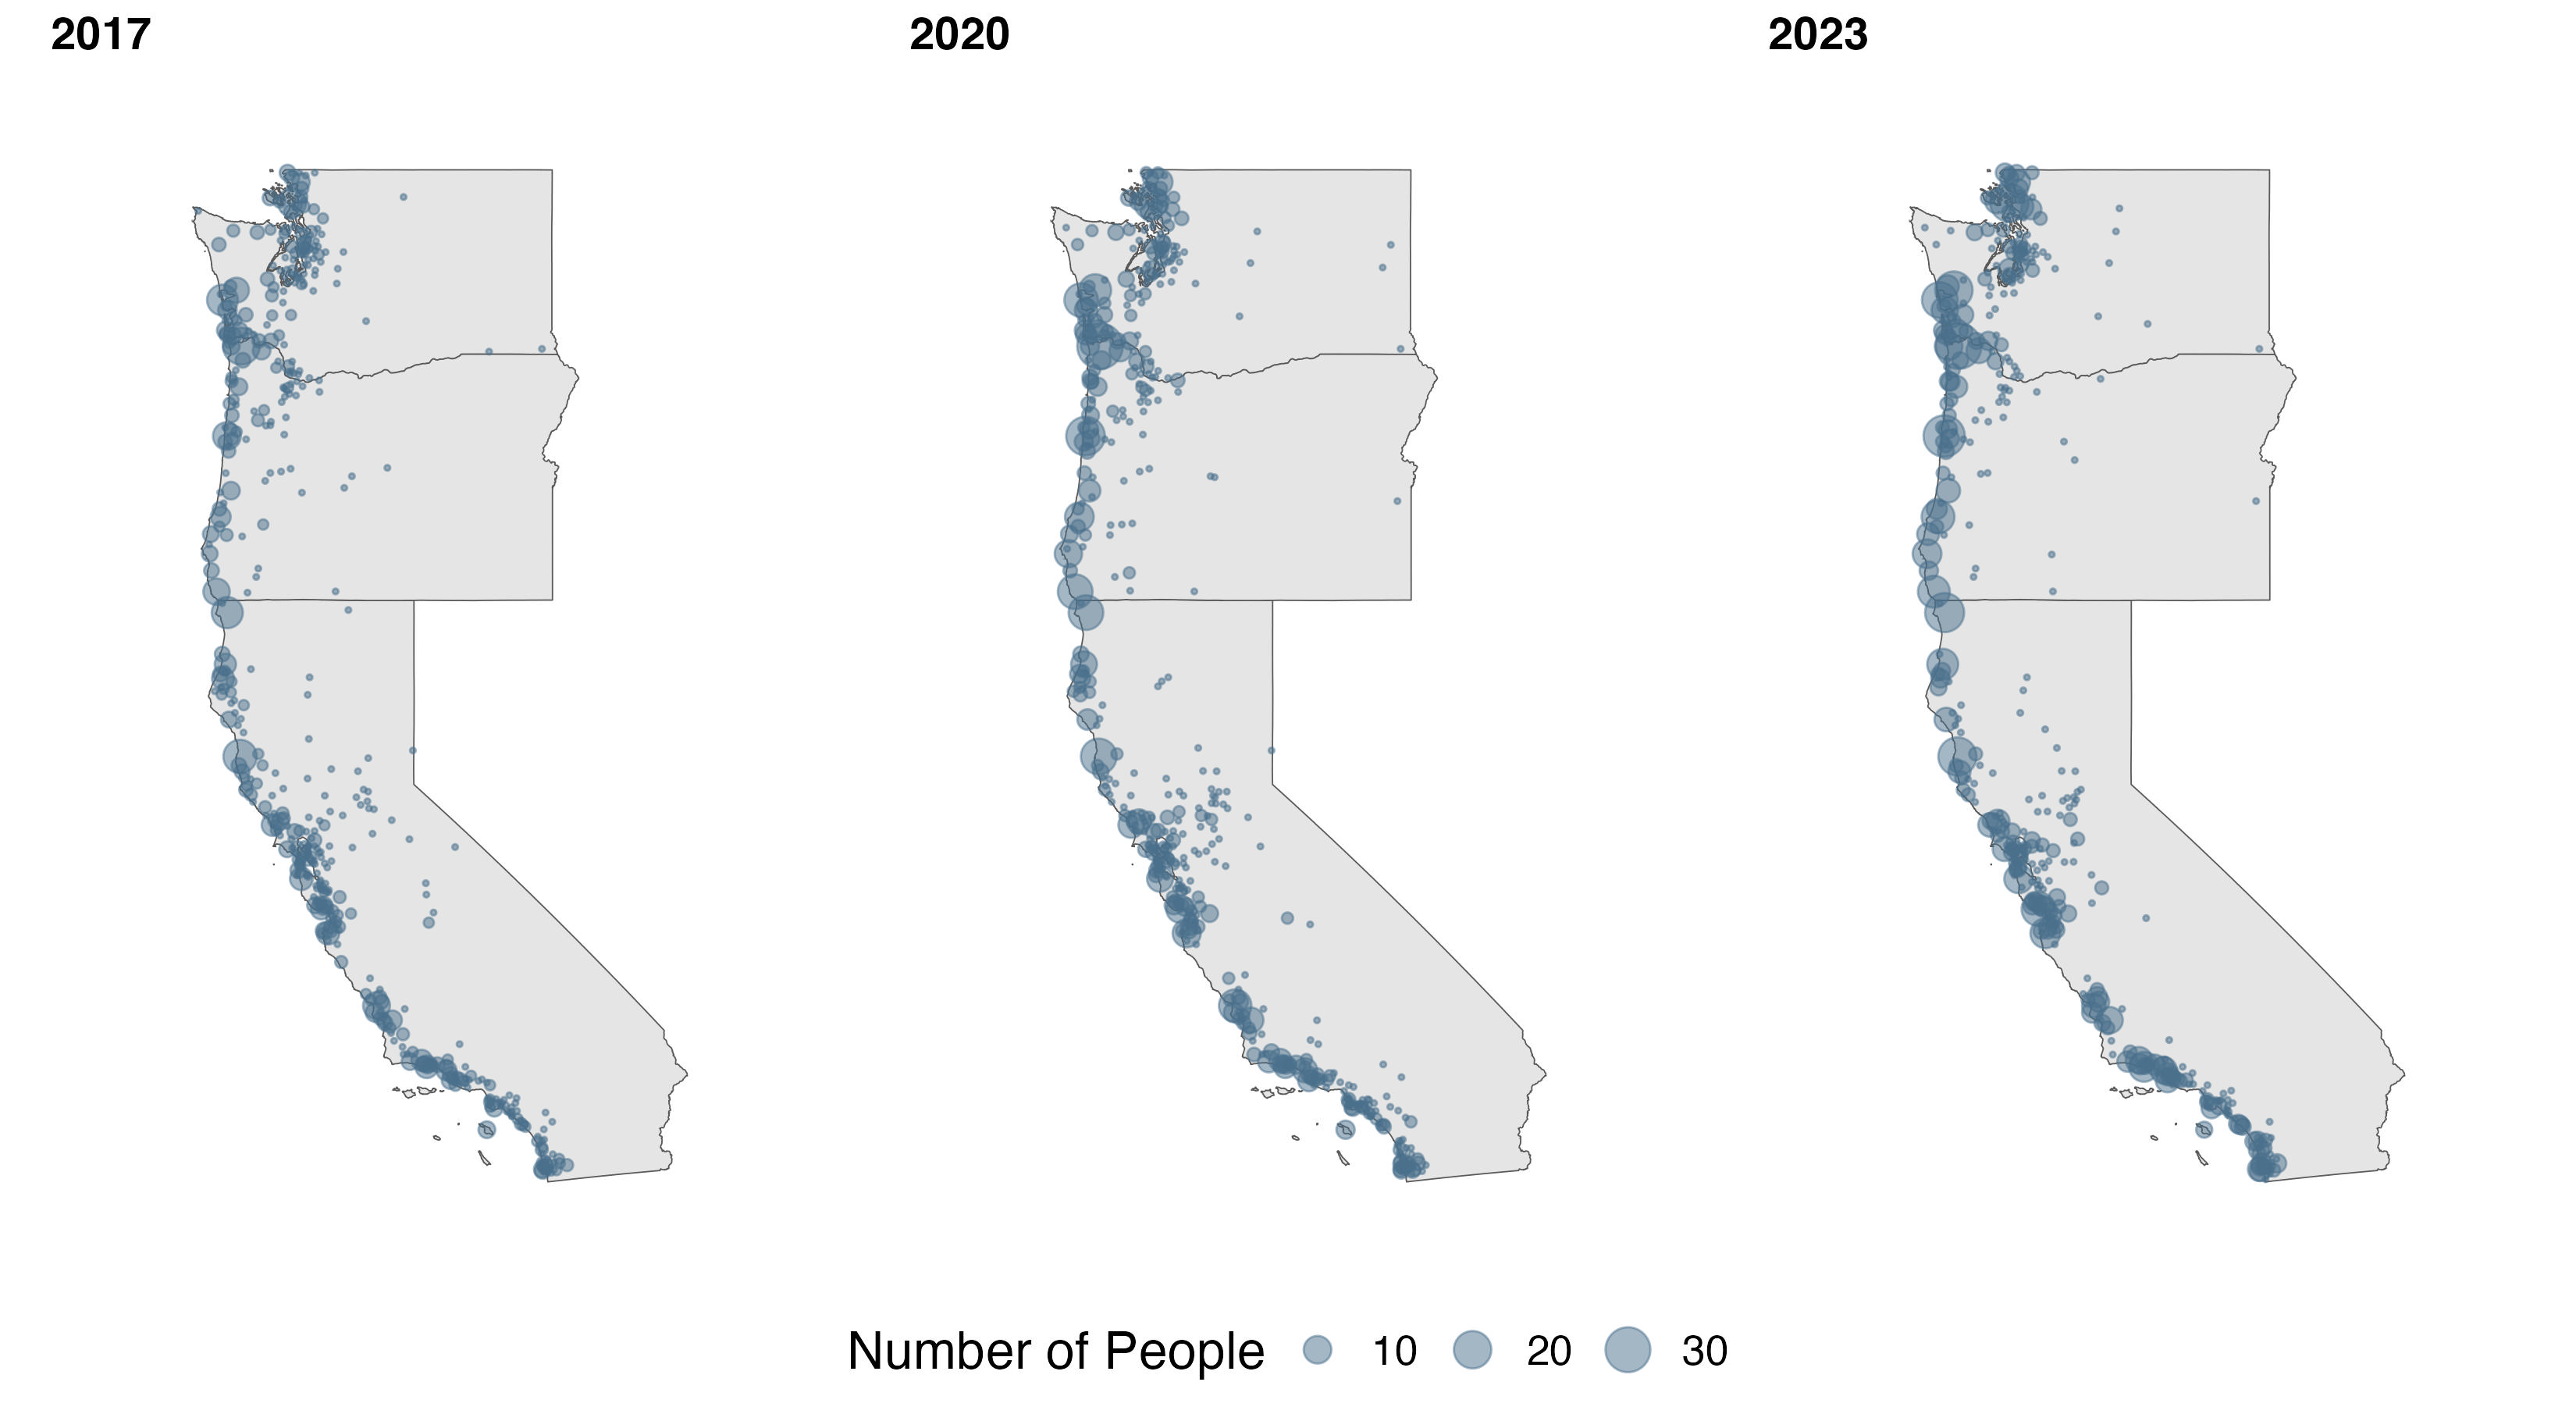
In 2017, 2020 and 2023, we conducted mail surveys to collect information about West Coast fishermen, why they choose to participate in commercial fishing, and the benefits they derive from fishing, including non-monetary benefits. We also wanted to understand how individuals and communities are affected when opportunities and profitability in particular fisheries change. We sent the survey to all vessel owners who had commercial fishery landings in Washington, Oregon or California in the year before each survey.. We received over 4000 responses to our surveys over the three years with 40-50% response rates each year. The distribution of those responses is shown in the maps below.
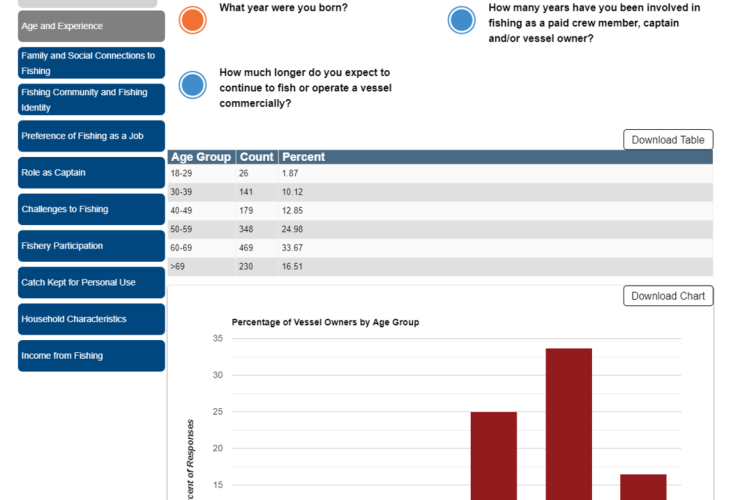
On this website you will find charts and tables summarizing responses to the survey questions. There are separate applications for viewing the 2017, 2020 and 2023 results. The surveys were largely similar but a few questions differ between years. The 2023 survey added new questions about direct marketing, access to infrastructure and equity and environmental justice. Results can be viewed for all respondents or by state of residence of the respondents. The frequency tables as well as the charts can be downloaded.