Current Conditions of the Northeast Shelf Ecosystem: Spring 2020 Update
A summary of temperature, salinity, chlorophyll and other conditions on the Northeast U.S. Continental Shelf during the second half of 2019.
Introduction
“Current Conditions” is a biannual report on ecosystem and fisheries data for the Northeast U.S. continental shelf ecosystem. The report includes measurements of temperature and salinity, indicators of seasonal warming and cooling patterns. We derive indicators describing phytoplankton distribution and blooms from satellite remote sensing data. Northeast Fisheries Science Center bottom trawl surveys provide upper trophic level indicators of fish and macroinvertebrate habitat and distribution dynamics.
Summary
- During the last half of 2019, sea surface temperatures in the Northeast U.S. Shelf Ecosystem continued to be above average. This follows a shift in thermal conditions that began around 2010. Both surface and bottom water temperatures from remote sensing and ship-board measurements reflect this trend.
- Fall phytoplankton blooms were generally at or below average with the exception of late season blooms in the Middle Atlantic Bight and Scotian Shelf subareas.
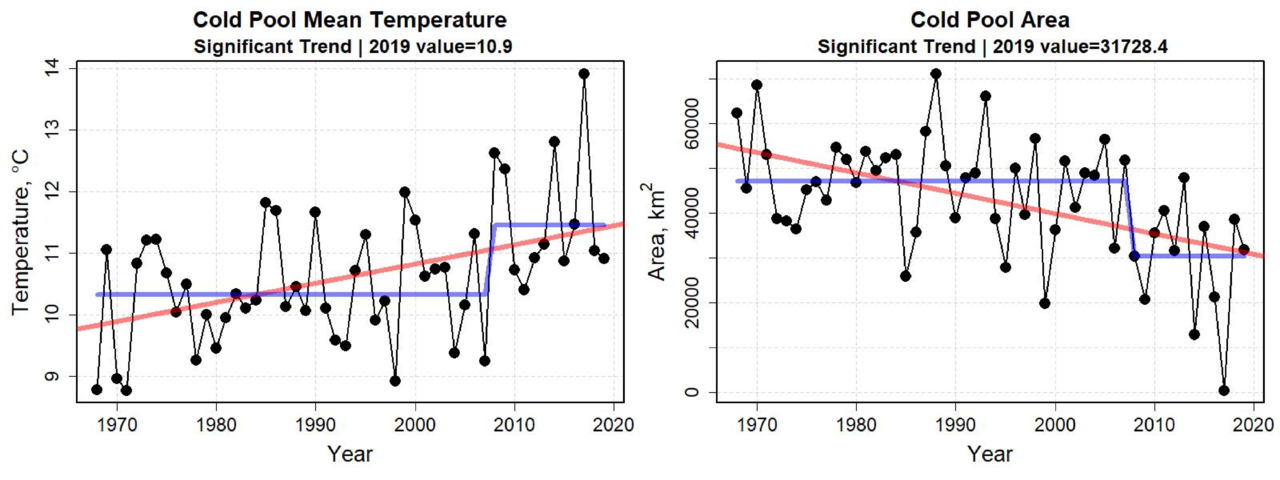
- The Middle Atlantic Bight cold pool continues to warm and diminish in size following an apparent transitional event in 2008.
- The 2019 survey provides the first measure of fish and invertebrate species distribution in three years. There were incomplete surveys during the fall of 2017 and 2018. Fish distribution in 2019 continues the trend of species displacement to the northeast, and suggests some species may have moved to shallower water.
Temperature
Daily Sea Surface Temperature for the Last Half of the Year
Daily sea surface temperatures were at or above average conditions during the last half of 2019. The Georges Bank and Gulf of Maine ecoregions had the largest departures from average conditions. Mid-summer temperatures were approximately 2°C above the average. In the Scotian Shelf and Middle Atlantic Bight, temperatures fluctuated around the mean. In all areas, temperatures moderated toward the mean by the end of the year.

Sea Surface Temperature Trends for the Last Half of the Year
Sea surface temperatures for the second half of 2019 continued at high levels in all ecoregions. However, thermal conditions have become more moderate since the record high temperatures observed in 2012. The linear trends in all ecoregions appear to be significant.

Trends in Variability of Sea Surface Temperature for the Last Half of the Year
Sea surface temperature variability (the standard deviation) for the last half of 2019 increased in the more northern ecoregions. The increase in variability appears to be significant in the Gulf of Maine and Scotian Shelf but not significant in the other areas. There were no clear-cut patterns in any change points in variability between areas.
Long-term Trends of Sea Surface Temperature for the Last Half Year
We derived the long-term temperature time series from the Extended Reconstructed Sea Surface Temperature dataset. It provides a low-resolution depiction of sea surface temperature on the Northeast Shelf since the 1850s. The data is based on historical shipboard measures and augmented with other data in recent years. The temperature for the last half of 2019 was above average. It generally matched the conditions during the warm period of the late 1940s and early 1950s.

Bottom Temperature Trends for the Last Half Year
The thermal conditions at the bottom of the water column are extremely important in defining the habitats for the majority of resource species. While we can measure sea surface temperatures by satellite remote sensing, we must measure bottom temperatures from ship surveys and other means. For this reason, we often have incomplete spatial and temporal sample coverage to describe bottom water temperatures. The bottom temperatures for the last half of the year have been increasing in all ecoregions. The temperature in all areas changed level around 2008.

Fall Thermal Transition Day
Phenology is the climate’s influence on the timing between plant and animal production cycles. Many marine organisms time their reproductive cycles to make best use of seasonal phytoplankton blooms, such as the spring and fall blooms. In turn, temperature plays a role in the development of blooms. Identifying the initiation date of the fall transition temperature, which varies by region, is likely related to different forcing factors. The fall thermal transition date was relatively constant from 1982 to approximately 2008 for the Northeast Shelf ecoregions. A change point appears in the northern areas around 2008, when the fall transition date advanced approximately two weeks. In recent years, the trend toward earlier fall transition dates appears significant in the Gulf of Maine, Georges Bank, and Scotian Shelf regions.

Salinity
Salinity and temperature can be indicators of the source water entering the ecosystem. Different water masses will contain different plankton species and have different amounts of nutrients that support phytoplankton blooms.
Surface Salinity Trends for the Last Half of the Year
Surface salinity, measured in practical salinity units, has increased in all ecoregions except Georges Bank. However, in some areas there appears to have been a regime shift in 2012, when salinities increased by approximately 0.5 practical salinity units. In all areas there is the suggestion that surface salinity moderated in recent years.

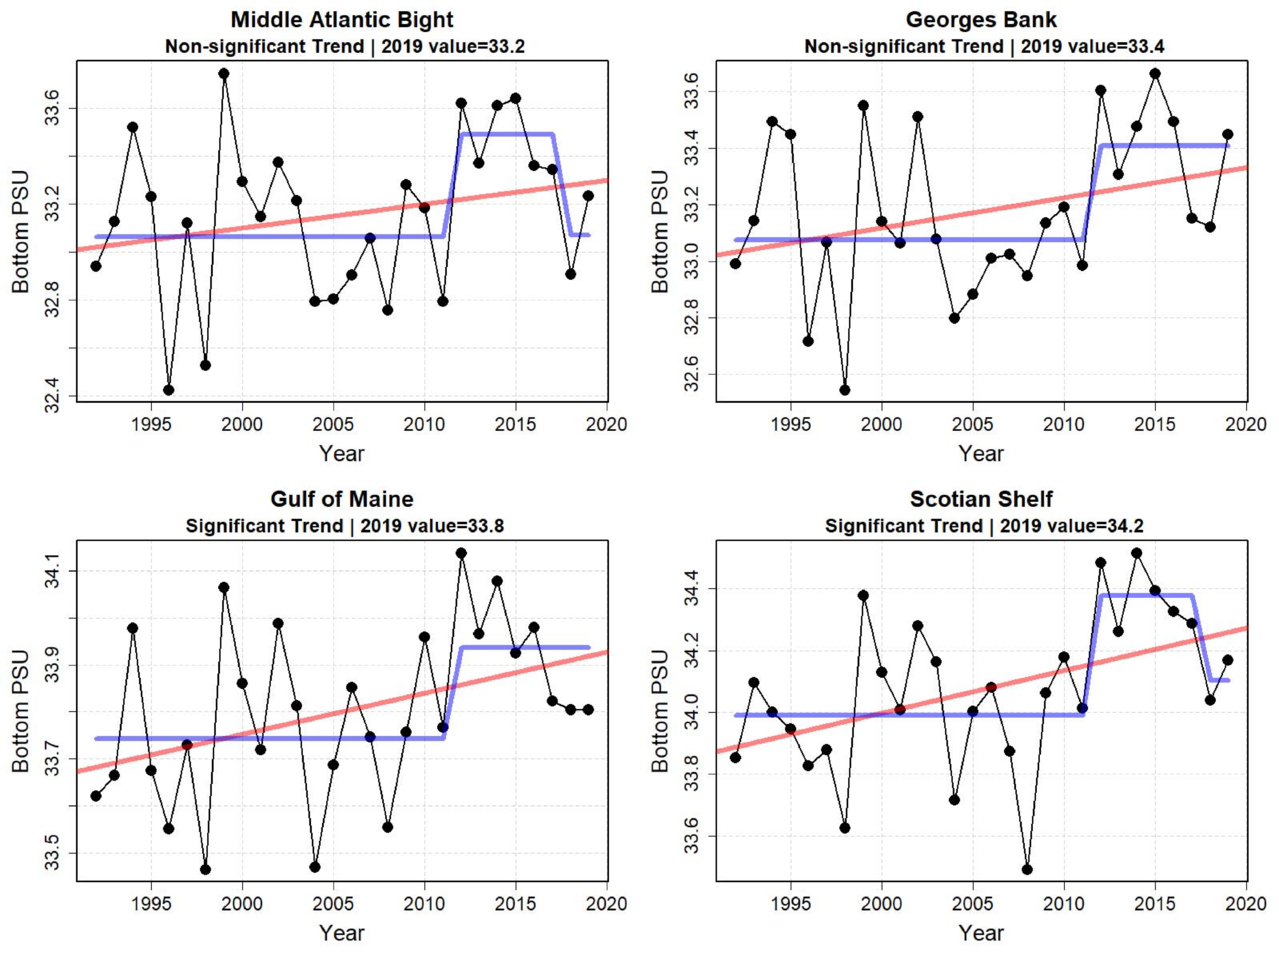
Bottom Salinity Trends for the Last Half of the Year
Bottom salinity increased in all ecoregions in the second half of 2019, but more dramatically in the Gulf of Maine and Scotian Shelf areas. There appears to have been a shift in salinity around 2012 by approximately 0.5 practical salinity units. In recent years, salinity has tended to moderate to levels around mean level.
Chlorophyll Concentration
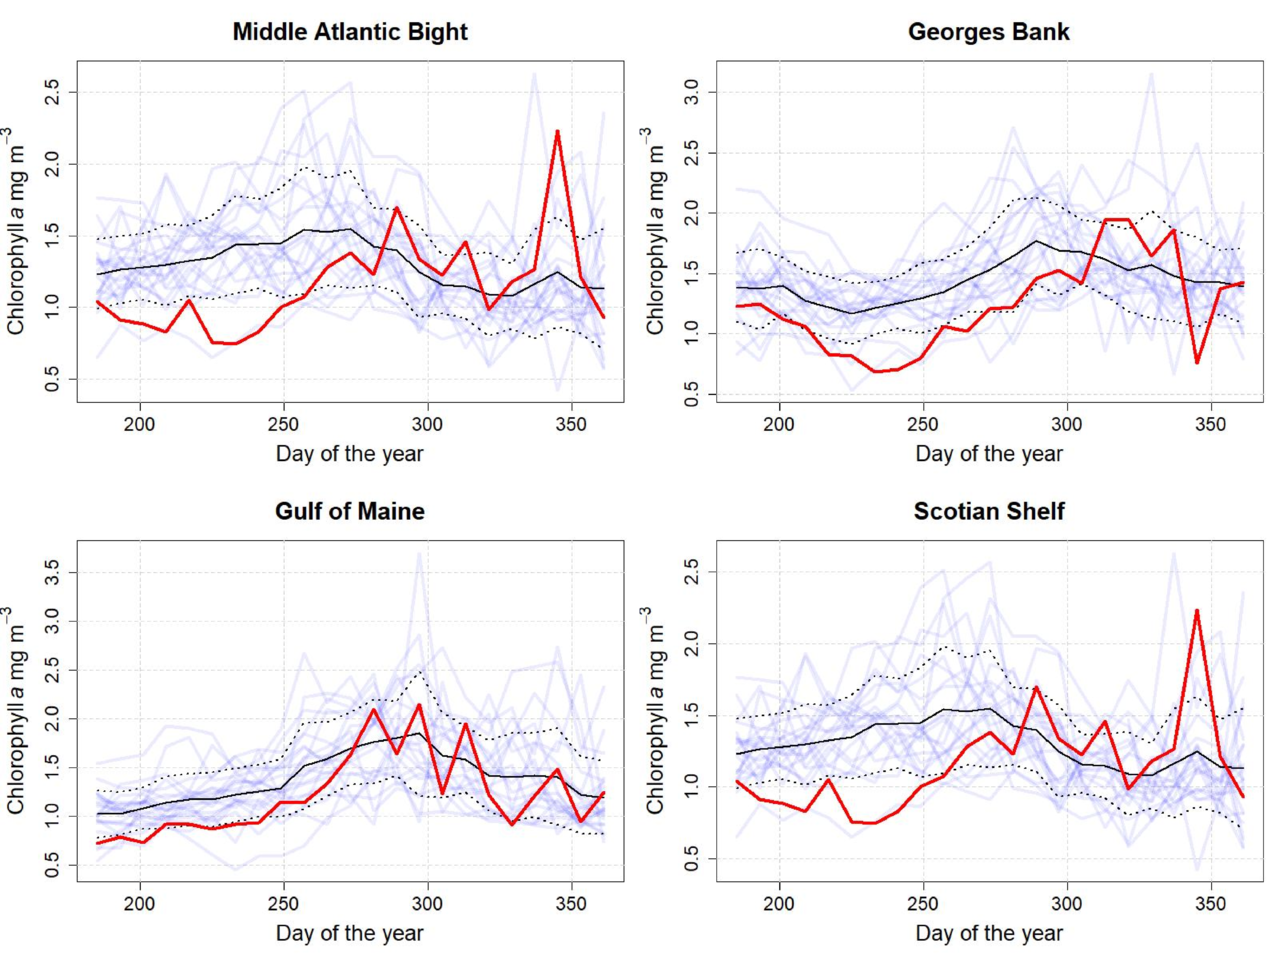
Weekly Chlorophyll for the Last Half of the Year
Chlorophyll concentration was generally below average during the last half of 2019. In areas that typically have a fall bloom, such as Georges Bank, chlorophyll concentration varied around the long-term average through the bloom period. The chlorophyll concentration for the Middle Atlantic Bight and Scotian Shelf was above average for one week late in the bloom period.
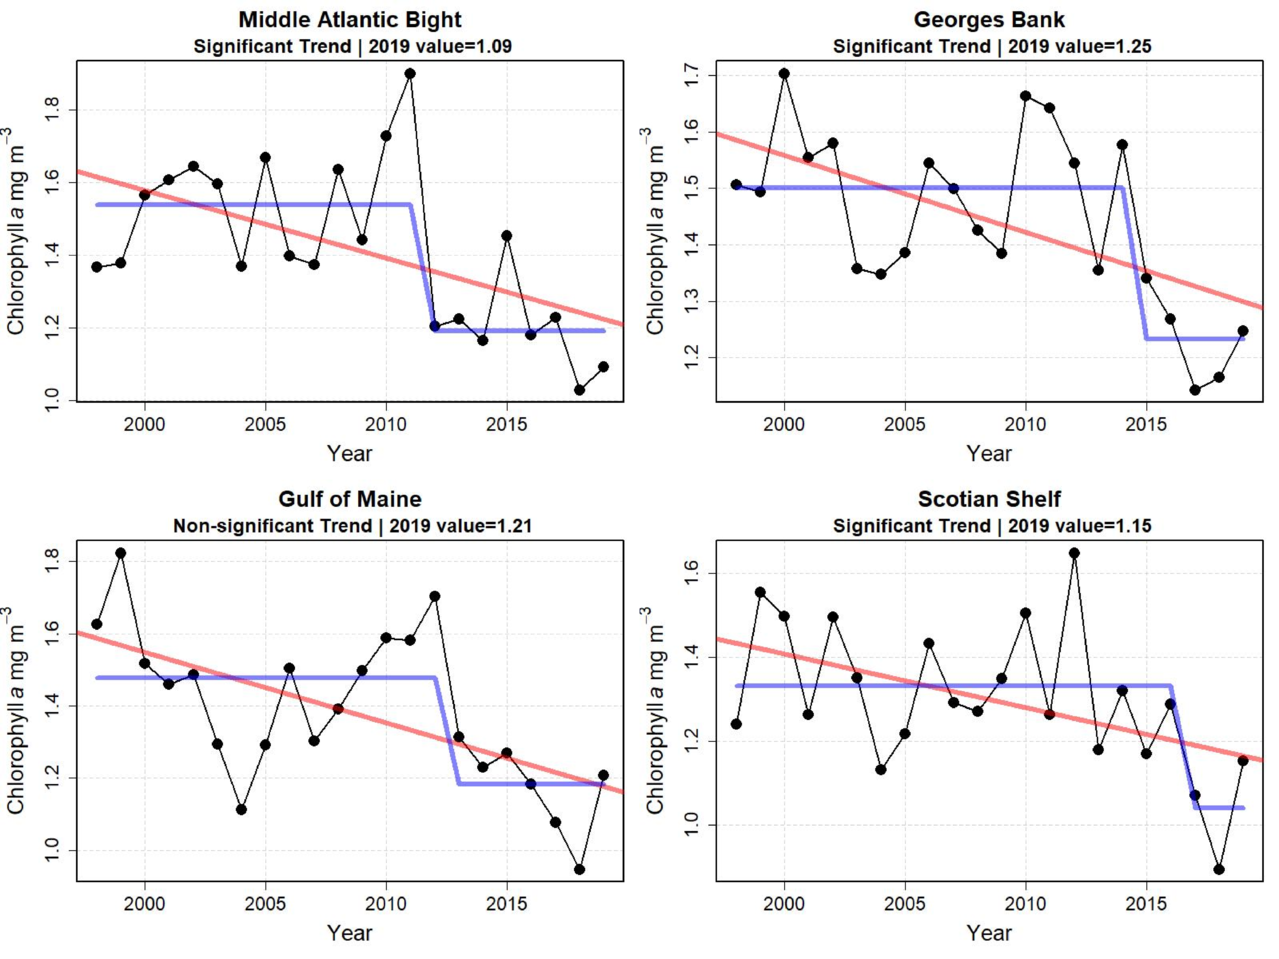
Chlorophyll Concentration Trends for the Last Half of the Year
Average chlorophyll concentrations during the last half of the year appear to have decreased in recent years in all subareas of the ecosystem. The most dramatic decline occurred in the Middle Atlantic Bight and Georges Bank areas. It is noteworthy that we have identified a change point in chlorophyll concentration in all areas within the last decade or so.
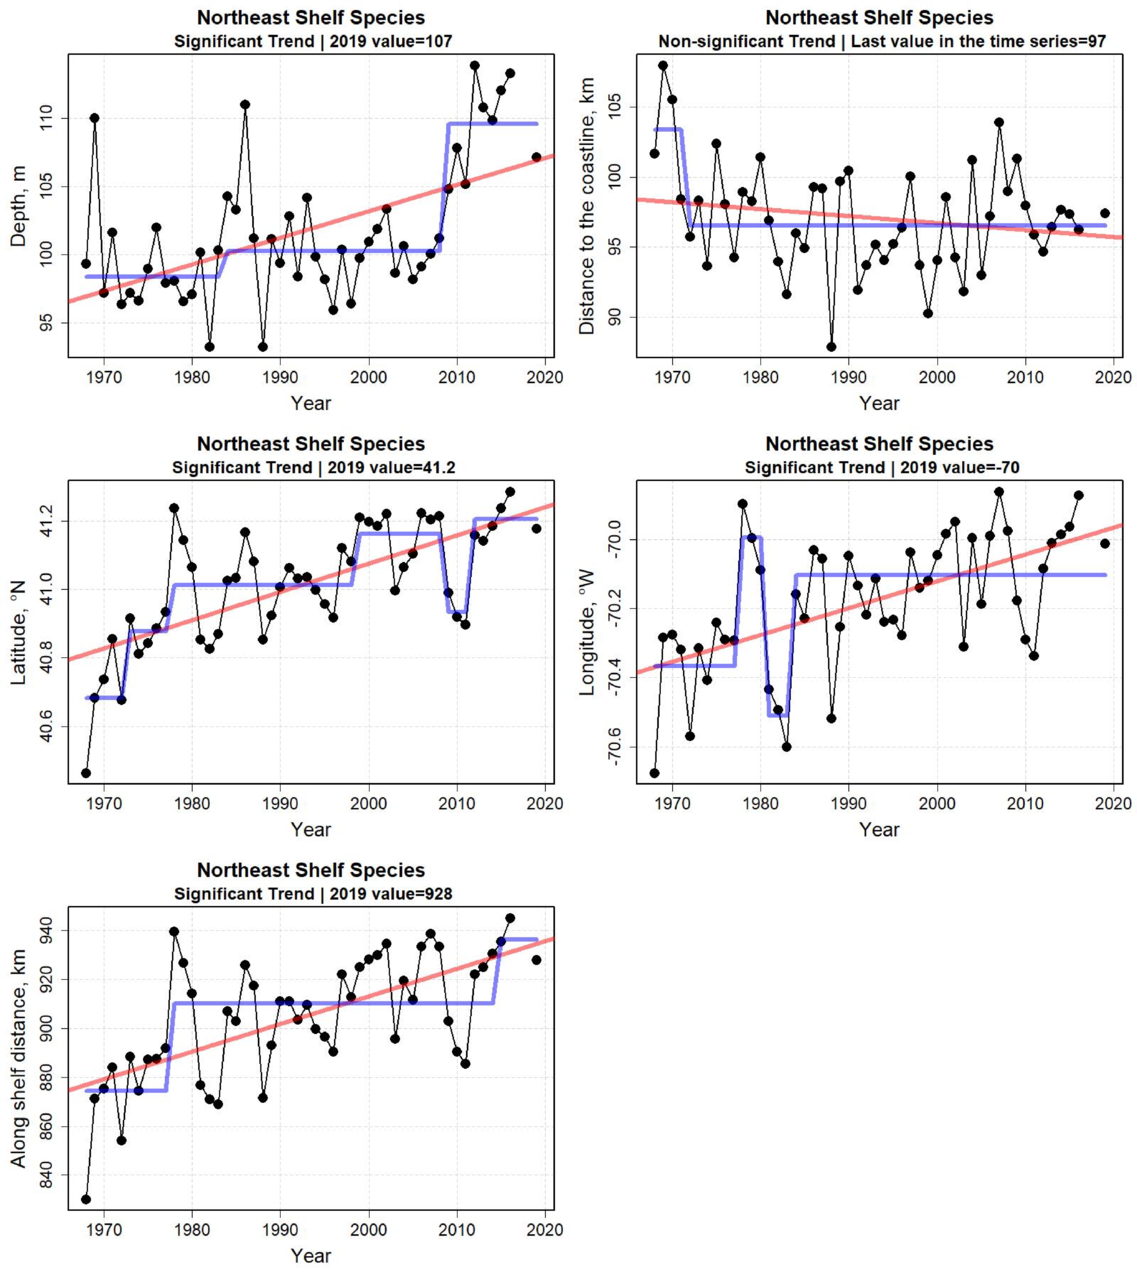
Trends in Species Distribution Metrics
Distribution of Northeast U.S. Shelf species has changed over recent decades. Individual species have shifted distribution for a number of reasons. We can characterize these shifts with the following metrics including the center of gravity of:
- Depth
- Distance to the coastline
- Latitude
- Longitude
- Along-shelf position in the ecosystem along an axis oriented from the southwest to the northeast
The time series plots below show the averages of these metrics for 48 of the more abundant Northeast Shelf species for the fall time frame. All metrics have increased significantly with the exception of distance to the coast, indicating a continuing species distribution shift to the northeast and into deeper water.
Ecosystem Forecast - Experimental Data Product
As weather and earth system models have improved, so have monthly forecasts over seasonal scales ranging up to seven months in advance. For each of the Northeast Shelf ecoregions, we provide forecasts from an ensemble of seven forecast models. They start with estimates for February 2020 and end in August 2020. The forecasts suggest that the Northern ecoregions will have above average sea surface temperatures, while the Middle Atlantic Bight will progressively experience less elevated temperatures.
Learn more about these ecosystem forecasts

Middle Atlantic Bight Cold Pool
The cold pool is an area of the Middle Atlantic Bight continental shelf dominated by cold water that persists through the summer months. The feature is important to the ecology of the region because it provides thermal conditions that retain many species. A cold pool index was developed from a snapshot of bottom water temperature in fall. The area of the cold pool has been declining over the time series and experienced a step change in conditions around 2008. The mean temperature of the cold pool has increased from approximately 10°C to current temperatures in excess of 11°C. Cold pool temperature also had a step change increase around 2008.