A dozen scientists and staff members from the Northeast Fisheries Science Center visited the 90-foot F/V Darana R in Point Judith, Rhode Island on October 3. The stop was a port call in the midst of the fall NorthEast Area Monitoring and Assessment Program (NEAMAP) survey off the coast of Rhode Island.
Science Center staff learned about the vessel, its equipment, and the survey. After some discussions in port, most stayed aboard as the vessel headed out to sea to sort fish from two tows made during an afternoon demonstration.

“This was a great opportunity for staff from the Northeast Fisheries Science Center to get out to sea for a few hours to see how they conduct the NEAMAP survey, and have a chance for Virginia Institute for Marine Science (VIMS) and Northeast Fisheries Science Center researchers to talk with each other and with the captain and crew about their operation. They are proud of it, and we appreciate their willingness to have us aboard,” said Anna Mercer, chief of the science center’s Cooperative Research Branch.
Each fall since 2006 the NEAMAP inshore trawl survey team has worked southward from Rhode Island toward Cape Hatteras, sampling juvenile and adult fish from dawn until dusk during four legs.

Captain Jimmy Ruhle, son Bobby Ruhle, and crew member Rigo Rodriguez deploy and retrieve all fishing gear, and work with six survey staff from VIMS. The survey collects data including catch, effort, and environmental conditions.

The team makes five tows on average per day. At the time of the visit, they had been catching a variety of fish, some unexpected. Earlier in the week they caught two large Atlantic sturgeon, lots of spot, and some weakfish. Recent warm weather and storms churned up the bottom waters, and catches included species usually seen in more southern waters. Tows made on the day of the visit captured more typical fish for the area and time of year: butterfish, scup, silver hake, winter flounder, squid, and some skates.
One of Founding Industry Partners
Darana R is one of the founding industry partners of what is now the Center’s Cooperative Research Branch. The vessel has been conducting the NEAMAP survey with the Virginia Institute of Marine Science since it began in 2006 with a pilot fall survey.

“We’ve been involved in the NEAMAP survey since the beginning, and we are committed to make it work,” said Captain Jimmy Ruhle, a third generation fisherman. His son Bobby and a 16-year-old grandson who joined him on a few trips this summer make it five generations. “It is an opportunity to collect information to show what is happening and to share that information. I enjoy working with the VIMS staff on the survey, and getting to know other fishermen in the areas where we work. We’ve done demonstrations like this for about 500 people through the years.”
And what does he do when not working on the survey, which takes up about two months of the year? “I fish for anything I can sell!”
Inshore Survey Helps Fill in Data Gaps
The NEAMAP survey helps fill in survey data for nearshore waters in the Mid-Atlantic and southern New England. It is an integrated, cooperative state/federal data collection program with the Atlantic States Marine Fisheries Commission.

The NEAMAP survey area includes waters from Cape Hatteras, North Carolina to Block Island and Rhode Island Sounds, to Martha’s Vineyard. They work in shallow waters closer to shore, usually to a depth of 60 feet but in certain places, like the mouth of Delaware Bay and in Rhode Island Sound, depths can be up to 120 feet.
In 2008 the vessel began conducting both spring and fall surveys, which are similar to those conducted by the NOAA Ship Henry B. Bigelow in deeper federal waters from 3 to 200 nautical miles offshore. Spring surveys start in the south and work north; fall surveys start in the north and work south.
The survey area is divided into 17 sub-areas. There are 150 stations, and tows at each station last 20 minutes. The sampling design and process are similar to those used for the federal bottom trawl survey aboard the Henry B. Bigelow.

To process the data collected on the survey, VIMS scientists developed a Windows-based customizable data acquisition system that can also be used for other fish survey projects, whether in the field or ashore. The system is called FEED, short for Fisheries Environment for Electronic Data.
Once data collection is completed and the information audited, it is available for inclusion in state and federal stock assessments. The NEAMAP data complement the NEFSC offshore data to provide information on the relative abundance of a variety of Mid-Atlantic fish stocks. These time-series of fishery independent data, which is obtained in the absence of any commercial or recreational fishing activity, measure seasonal and annual changes in abundance that inform the stock assessment models used to support management decisions.
Opportunity to Collaborate, Share Information
Dustin Gregg, the chief scientist for the survey, has been with the Multispecies Research Group at VIMS Fisheries Science Branch for 9 years. Other survey members have experience ranging from 1 to 12 years and spend about a month each spring and fall on the survey.

“Working within a cooperative/collaborative setting provides the best opportunity for success, both from operational and scientific standpoints. Open communication and the development of a trusting relationship is vital to the longevity of a survey like NEAMAP, “said Gregg, chief of trawl survey operations at VIMS. “The scientific crew trust that Captain Jimmy and the boat crew will deploy and operate the gear optimally and safely on every tow. Likewise, the vessel crew trusts that once the catch is onboard, the scientific crew will process the catch and collect high quality, clean data using best practices.”
“There are countless benefits to cooperative research,” Gregg said, “but ultimately this relationship has helped NEAMAP produce substantial quantities of nearshore data that have the confidence of both the fishing industry and the scientific community.”

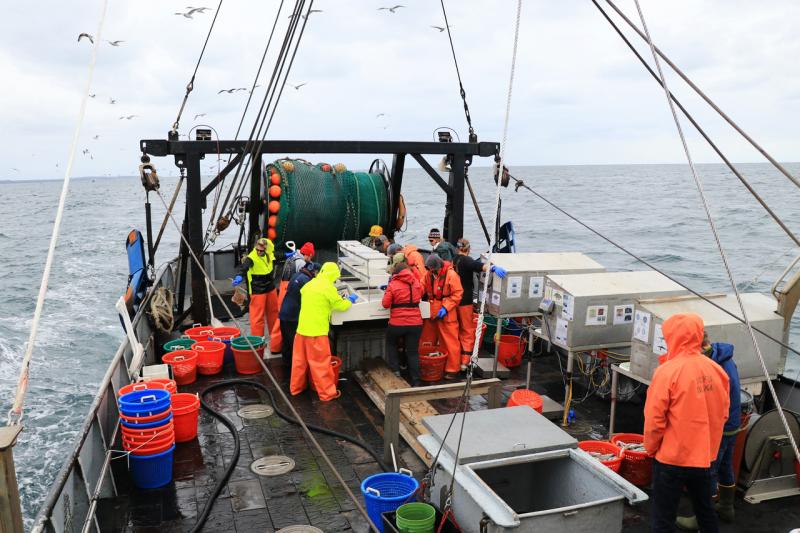
During the visit NOAA staff had a chance to see the survey in action and lend a hand. Once the first tow was up on the back deck and the net was emptied, fish were shoveled onto a sorting table. The NEFSC staff who had worked on survey cruises before joined the NEAMAP crew to sort the catch into small bins and then into color-coded baskets.
Three survey members worked at sampling tables on the port side of the deck collecting aggregate weights and individual lengths. Five fish per species per size class were subsampled.
The vessel’s fish hold below deck served as a temporary wet lab for further sampling: otoliths to determine age, stomachs for diet analyses, gonads for sex and maturity.

“NEAMAP provides state and federal researchers with a time series of species abundance, biomass and environmental conditions in nearshore waters not sampled by federal and state trawl surveys,” said Mercer. She worked on Darana R in the past, as had several of the other NEFSC staff along on the trip.