In 2020, our nation and the commercial and recreational fishing industries faced unprecedented challenges in the face of the COVID-19 pandemic. Virtually every part of the fishing industry experienced impacts in some form and information on the fishing industry is even more important than ever. The Fisheries of the United States 2020 report highlights how NOAA, the regional fishery management councils, and our stakeholders worked together to answer the challenge of COVID-19 while ensuring the sustainability and economic stability of our nation’s fisheries.
This year we’re showcasing a new streamlined report with additional online data and a brand new highlights page. As always, the report provides a snapshot of commercial and recreational fishing data. The new dual platform offers high-level numbers and engaging graphics as well as in-depth information for a deeper dive into the data.
“These transformative tools will improve access to the important fisheries data that is relied upon by so many in the fishing community," said Dr. Jon Hare, Acting Director of Scientific Programs and Chief Science Advisor for NOAA Fisheries. "I’m proud of our team in meeting the challenges of the past few years and continuing to provide this critical information.”
Commercial Fishing
U.S. fishermen at ports in the 50 states landed 8.4 billion pounds valued at $4.7 billion in 2020. These numbers indicate decreases in landings and value compared to 2019. However, they show that U.S. fishermen faced the challenge of a global pandemic and still provided the nation with nutritious, sustainable seafood.
Dr. Hare highlighted the importance of our ports, nothing that “U.S. ports remain an integral part of vibrant and resilient coastal communities. Congratulations to Dutch Harbor, Alaska, and New Bedford, Massachusetts, as they top the ports list for volume and value. This continues a more than two decade trend driven by landings of pollock for Alaska and value of sea scallops in Massachusetts.”
Other highlights from the commercial fishing sector include landings of 3.2 billion pounds for the nation’s largest commercial fishery, walleye pollock, valued at $420 million. The five highest
value commercial species categories are:
- Crabs ($584 million)
- Lobsters ($563 million)
- Scallops ($488 million)
- Salmon ($478 million)
- Shrimp ($435 million)
- Alaska (walleye) pollock ($420 million)
Recreational Fishing
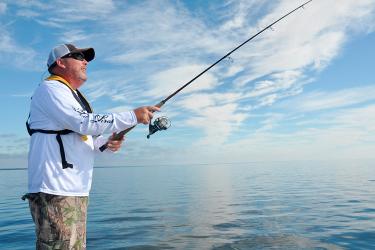
The recreational fishing industry, along with its associated businesses, continued to provide Americans with engaging recreational opportunities.
In our recreational fisheries, U.S. anglers took nearly 200 million trips in 2020. These recreational anglers caught an estimated 1 billion fish and released 65 percent of those caught. The total recreational harvest was estimated at 343 million fish weighing more than 353 million pounds. The top six recreational U.S. saltwater species ranked by harvested weight were:
- Yellowfin tuna
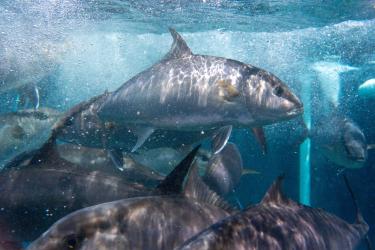
- Blue runner
- Striped bass
- Red snapper
- Bluefish
- Spanish mackerel
Foreign Trade
We live in a global marketplace with a robust and interconnected supply chain which saw the U.S. import $21.4 billion worth of edible seafood products. Top imported products were shrimp, salmon fillet, whole salmon, whole tuna, and canned tuna.
Overall, shrimp remains the most valuable import accounting for 27 percent of the value of total edible imports. The United States also exported 2.4 billion pounds of seafood valued at $4.4 billion. The top valued exports were:
- Whole or eviscerated salmon (primarily sockeye)
- Whole groundfish
- Surimi
- Lobster
- Caviar and roe
- Crab and crabmeat


