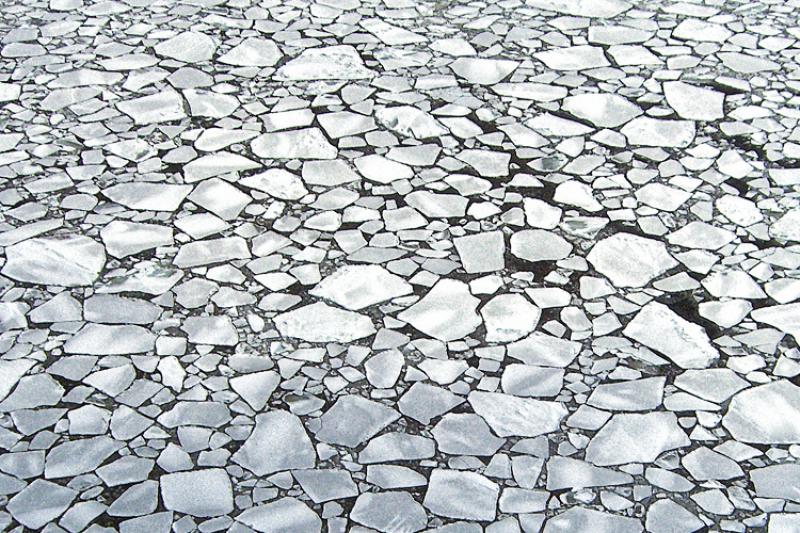
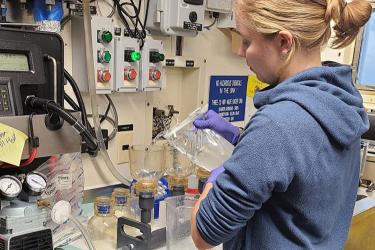
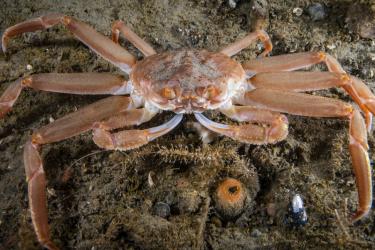
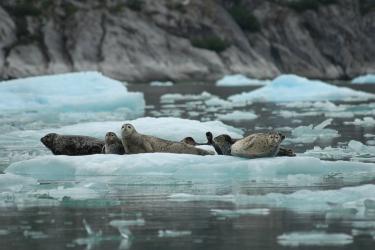
“In 2015, we observed above normal ocean temperatures, early sea ice retreat, unusual mortality of large whales, dead seabirds, and record low counts of young walleye pollock,” said Stephani Zador, editor of the ecosystem report. “We bring together and analyze data from many scientists to provide an assessment of the possible future effects of climate and fishing on ecosystem structure and function.”
The indicators are “vital signs” of ecosystem health. Like an annual physical exam, assessing these indicators tells about the overall state of ecosystem health and may provide early warning signs to prevent future problems.
Use of Ecosystem Information in Management Decisions

Every December, the North Pacific Fishery Management Council sets catch limits for groundfish in federal waters off Alaska for the upcoming fishing year. They base these decisions on scientific research and analysis including fish stock assessments, economic information on the commercial fishery, and an annual ecosystem assessment.
“Ecosystem assessments help us understand the big picture by explaining, among other things, how changes in the ecosystem might affect present and future abundance of commercially important groundfish stocks,” says Council Scientific and Statistical Committee member George Hunt.
These assessments tell a much more complete story than measuring fish abundance alone. For example, if there are a lot of young fish this year, but indicators show a poor food supply for them, then it’s likely that fewer of those young fish will grow and survive into the next year.
“Based on what these indicators tell us, we’ve adjusted catch limits on groundfish stocks in some years,” added Hunt.
Indicator Selection
NOAA Fisheries scientists developed a set of ecosystem indicators for the waters surrounding Alaska to monitor four objectives established by the council:
- Maintain predator-prey relationships
- Maintain diversity
- Maintain habitat essential to fish and their prey
- Monitor effects of climate change
As an example, to monitor the effects of climate change, scientists measure indicators such as North Pacific climate and sea surface temperatures; groundfish recruitment and survival; ice retreat and extent; and summer zooplankton biomass.
Over the years the number of indicators monitored has grown from a core list of indicators, which are still measured, including water temperatures and abundances of target and non-target species, to hundreds.
“We add new indicators each year as more data becomes available, but we also remove indicators if scientific studies end or the indicators are no longer relevant,” Zador says. “For the first time this year, we have a rough estimate of spring zooplankton abundance from the current year. This is exciting because there is usually a 1-2 year lag to get this information because it takes a long time to identify and count zooplankton.”
Other new indicators include:
- Survival of coho salmon
- Large zooplankton abundance as an indicator of pollock recruitment to age-3 in Southeast Bering Sea
- Disease ecology indicators such as “mushy” halibut syndrome, a condition that causes muscle to become jelly-like and indicates poor foraging conditions for young halibut
Scientists produced the first annual ecosystem report card in 2010 for the eastern Bering Sea. Subsequently, report cards were produced for the Aleutian Islands and the Arctic. This year, scientists produced a report card for the Gulf of Alaska.
“As we add more data each year, we become more confident in our ability to monitor what’s happening in these four marine ecosystems,” said Zador. “All of this helps fisheries managers to determine what steps to take to ensure a sustainable supply of commercially important fish stocks while preserving the health of the overall ecosystem.”

2015 Eastern Bering Sea Report Card. As part of the ecosystem report, time series of the top indicators selected by a teams of experts to best represent each ecosystem are summarized in “report cards” for fishery managers. Beginning in 2010, report cards were created for Bering Sea, Aleutian Islands, and Arctic ecosystems, and for the first time this year, the Gulf of Alaska.
Additional Resources


