The U.S. West Coast has faced many ocean challenges in recent decades, including prolonged marine heatwaves, harmful algal blooms, and acidifying coastal waters. These events can cause disruptions to—or even the collapse of—critical fisheries and ecosystems that support coastal communities and economies.
Through the Changing Ecosystems and Fisheries Initiative, NOAA has developed a new high-resolution ocean model to understand and predict West Coast ocean changes. This model simulates ocean conditions along the West Coast based on atmospheric conditions, such as winds and air temperatures, and changes in the Pacific and Arctic ocean circulation. This provides a foundation for understanding the past and predicting future ocean conditions on seasonal to multi-decadal time horizons.
The West Coast model configuration stretches from the Baja Peninsula through the Bering Sea, providing a cohesive picture of coast-wide ocean conditions. It was developed by researchers from NOAA and academic partners. It will provide resource managers, coastal communities, industries, and other decision makers with actionable information to increase resilience to changes in ocean conditions.
Past Ocean Changes Help Us Predict the Future
The first product developed using the West Coast model is a high-resolution retrospective ocean simulation covering the last three decades, also known as a “hindcast.” This product is available online and will help scientists, managers, and industry partners understand past ocean and fisheries changes. It will also provide the foundation for reliable future forecasts and projections.

Ocean modelers and fisheries experts worked together to identify important ocean features impacting fisheries productivity and ecosystem health, such as bottom temperature and oxygen levels. The model is designed around these critical features, which are not well-resolved in global ocean prediction systems. Focusing on user-relevant conditions ensures that the model can be applied to the intended regional applications, such as fisheries management plans for stocks in U.S. coastal waters.
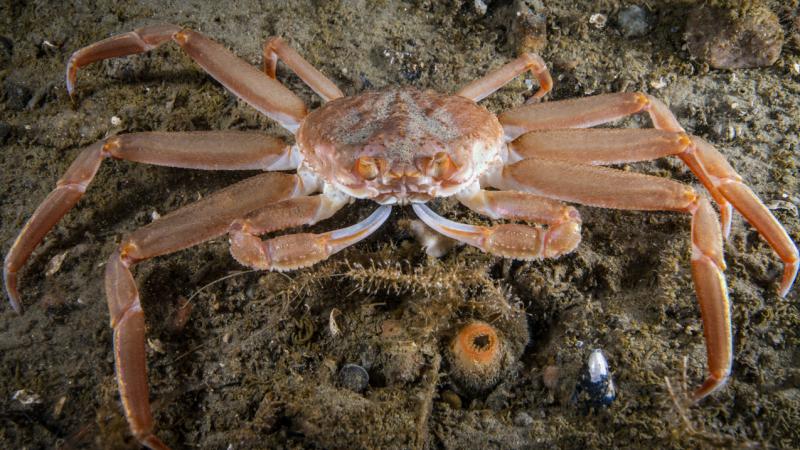
For example, several economically important fisheries in the Bering Sea require the maintenance of cold bottom water throughout the summer months. Survey data collected by NOAA Fisheries has shown that the size of this “cold pool” has varied considerably over the past 30 years. A string of particularly small cold pools contributed to the recent collapse of the invaluable snow crab fishery. The model development team used trawl survey and mooring data to assess and improve the model, leading to an accurate simulation of variations in this key feature.
“The cold pool result was a great example of our co-development process at work,” says Elizabeth Drenkard, lead model developer and scientist at NOAA’s Geophysical Fluid Dynamics Laboratory. “Alaska Fisheries Science Center staff provided trawl survey data and cold pool measures developed with their stakeholders. Colleagues at the NOAA’s Pacific Marine Environmental Laboratory used data from their long-term moorings and regional expertise to understand model limitations and address them. Now that we have successfully simulated past cold pool variations, we can turn our attention to predicting future changes.”
The model can now be used to better understand the factors that determine cold pool extent, such as winter sea ice and seasonal weather patterns. Model results can also be integrated with fisheries and ecosystem models to further understand past fisheries changes. Successful simulations of past cold pool variations are a necessary starting point for future predictions.

“We’re encouraged by this new model’s ability to skillfully replicate ocean features that were involved in past fisheries changes, including the recent snow crab collapse,” adds Dr. Kirstin Holsman, a fisheries biologist at the Alaska Fisheries Science Center. “We’re integrating this new information stream into the tools that we use to inform coastal decision-makers, which is a leap forward in predictive advice that will bolster resilient fisheries and vibrant coastal communities.”
These new capabilities could also help us improve our understanding of fisheries off of Washington, Oregon, and California. “Several of our stock assessments—including sablefish, petrale sole, and northern yellowtail rockfish—integrate environmental conditions,” says Jameal Samhouri, an ecosystem science program manager at the Northwest Fisheries Science Center. “This new, dedicated hindcast model will be evaluated for these stocks as we modernize and update our science advice to the Pacific Fishery Management Council.”
A National Ocean Prediction and Decision Support System for Fisheries
The high-resolution West Coast model joins its previously delivered East Coast configuration as a foundation for ocean predictions. Analogous teams of modeling, fisheries, and ecosystem experts are also developing systems for the Great Lakes, Pacific Islands, and the Arctic. This national ocean prediction system is built on NOAA’s Modular Ocean Model 6 (MOM6). It is integrated with a comprehensive ocean biogeochemical model developed for NOAA’s Earth System Models and powered by its High Performance Computing System.
On the West Coast, efforts have now turned to generating seasonal outlooks, which encapsulate 1 to 12 months, and longer-term outlooks, which span multiple years. These forthcoming outlooks will help us anticipate future changes, similar to those recently released for the East Coast. “Initial experimental seasonal outlooks for the West Coast model are underway and we expect to be able to produce regular seasonal forecasts starting in 2026,” says Dr. Mike Jacox, a scientist with the Southwest Fisheries Science Center and NOAA’s Physical Sciences Laboratory. “Understanding the past is an important first step, but what we ultimately need to inform fisheries and ecosystem decisions is the ability to anticipate change.”