Mobile Acoustic Surveys to Map Bathymetry and Quantify the Densities and Distributions of Salmonid Smolt Predators in the San Joaquin River.
The San Joaquin River Predator Surveys Project was conducted by NOAA Fisheries (National Marine Fisheries Service) and supported by the California Department of Water Resources (DWR, Agreement # 4600010100).

This was part of a larger, collaborative Head of Old River Predator Study that included Testing the Effects of Manipulated Predator Densities and Prey Transit Time on Juvenile Salmonid Survival at the San Joaquin and Old River Confluence. PIs: S. Hayes, D. Huff, C. Michel, M. Sabal, D. Demer, and S. Lindley.
Repeated acoustic surveys of the San Joaquin River were conducted during spring 2014 and 2015 to produce bathymetric maps of the river and estimate fish densities. Results of this study are published in NOAA Technical Memorandum NOAA-TM-NMFS-SWFSC-575.
Recommended citation: G. R. Cutter Jr., S. C. Manugian, J. Renfree, J. Smith, C. Michel, D. Huff, T.S. Sessions, B. E. Elliot, K. Stierhoff, S. Mau, D. Murfin, and D. A. Demer. 2017. Mobile Acoustic Sampling to Map Bathymetry and Quantify the Densities and Distributions of Salmonid Smolt Predators in the San Joaquin River. NOAA Technical Memorandum, NOAA-TM-NMFSSWFSC-575. 134 pp.
This page provides links to data including bathymetric surfaces and fish counts and densities that are summarized in the Tech Memo. Credit for use of these datasets should be provided in publications by citing the Tech Memo or this website.
FISH COUNTS AND DENSITIES
These data are NOT to be used for navigation.

Two split-beam sonars, Simrad EK60 120kHz and 200kHz, provided fish echo-track detections from surveys in 2014 and 2015. One transducer was oriented horizontally (120kHz) and one vertically (200kHz). Counts of fish echo tracks were converted to fish densities (#/1000-m3) by accounting for the insonified volumes of the sonar beams.
The image to the right represents data collected by the horizontal transducer. Echo tracks (colored polygons) present as sequential single targets clustered by echo-track parameters.
Datasets
2014 Horizontal: Echo track counts from the 120-kHz EK60 beam directed 45° to the port side. Daily counts and densities
2015 Horizontal: Echo track counts from the 120-kHz EK60 beam directed forward. Daily counts and densities
2015 Vertical: Daily counts and densities
2014 + 2015 Sampled Volumes: River volume and sampled volume
Metadata: Fish .csv files (above) and volumes
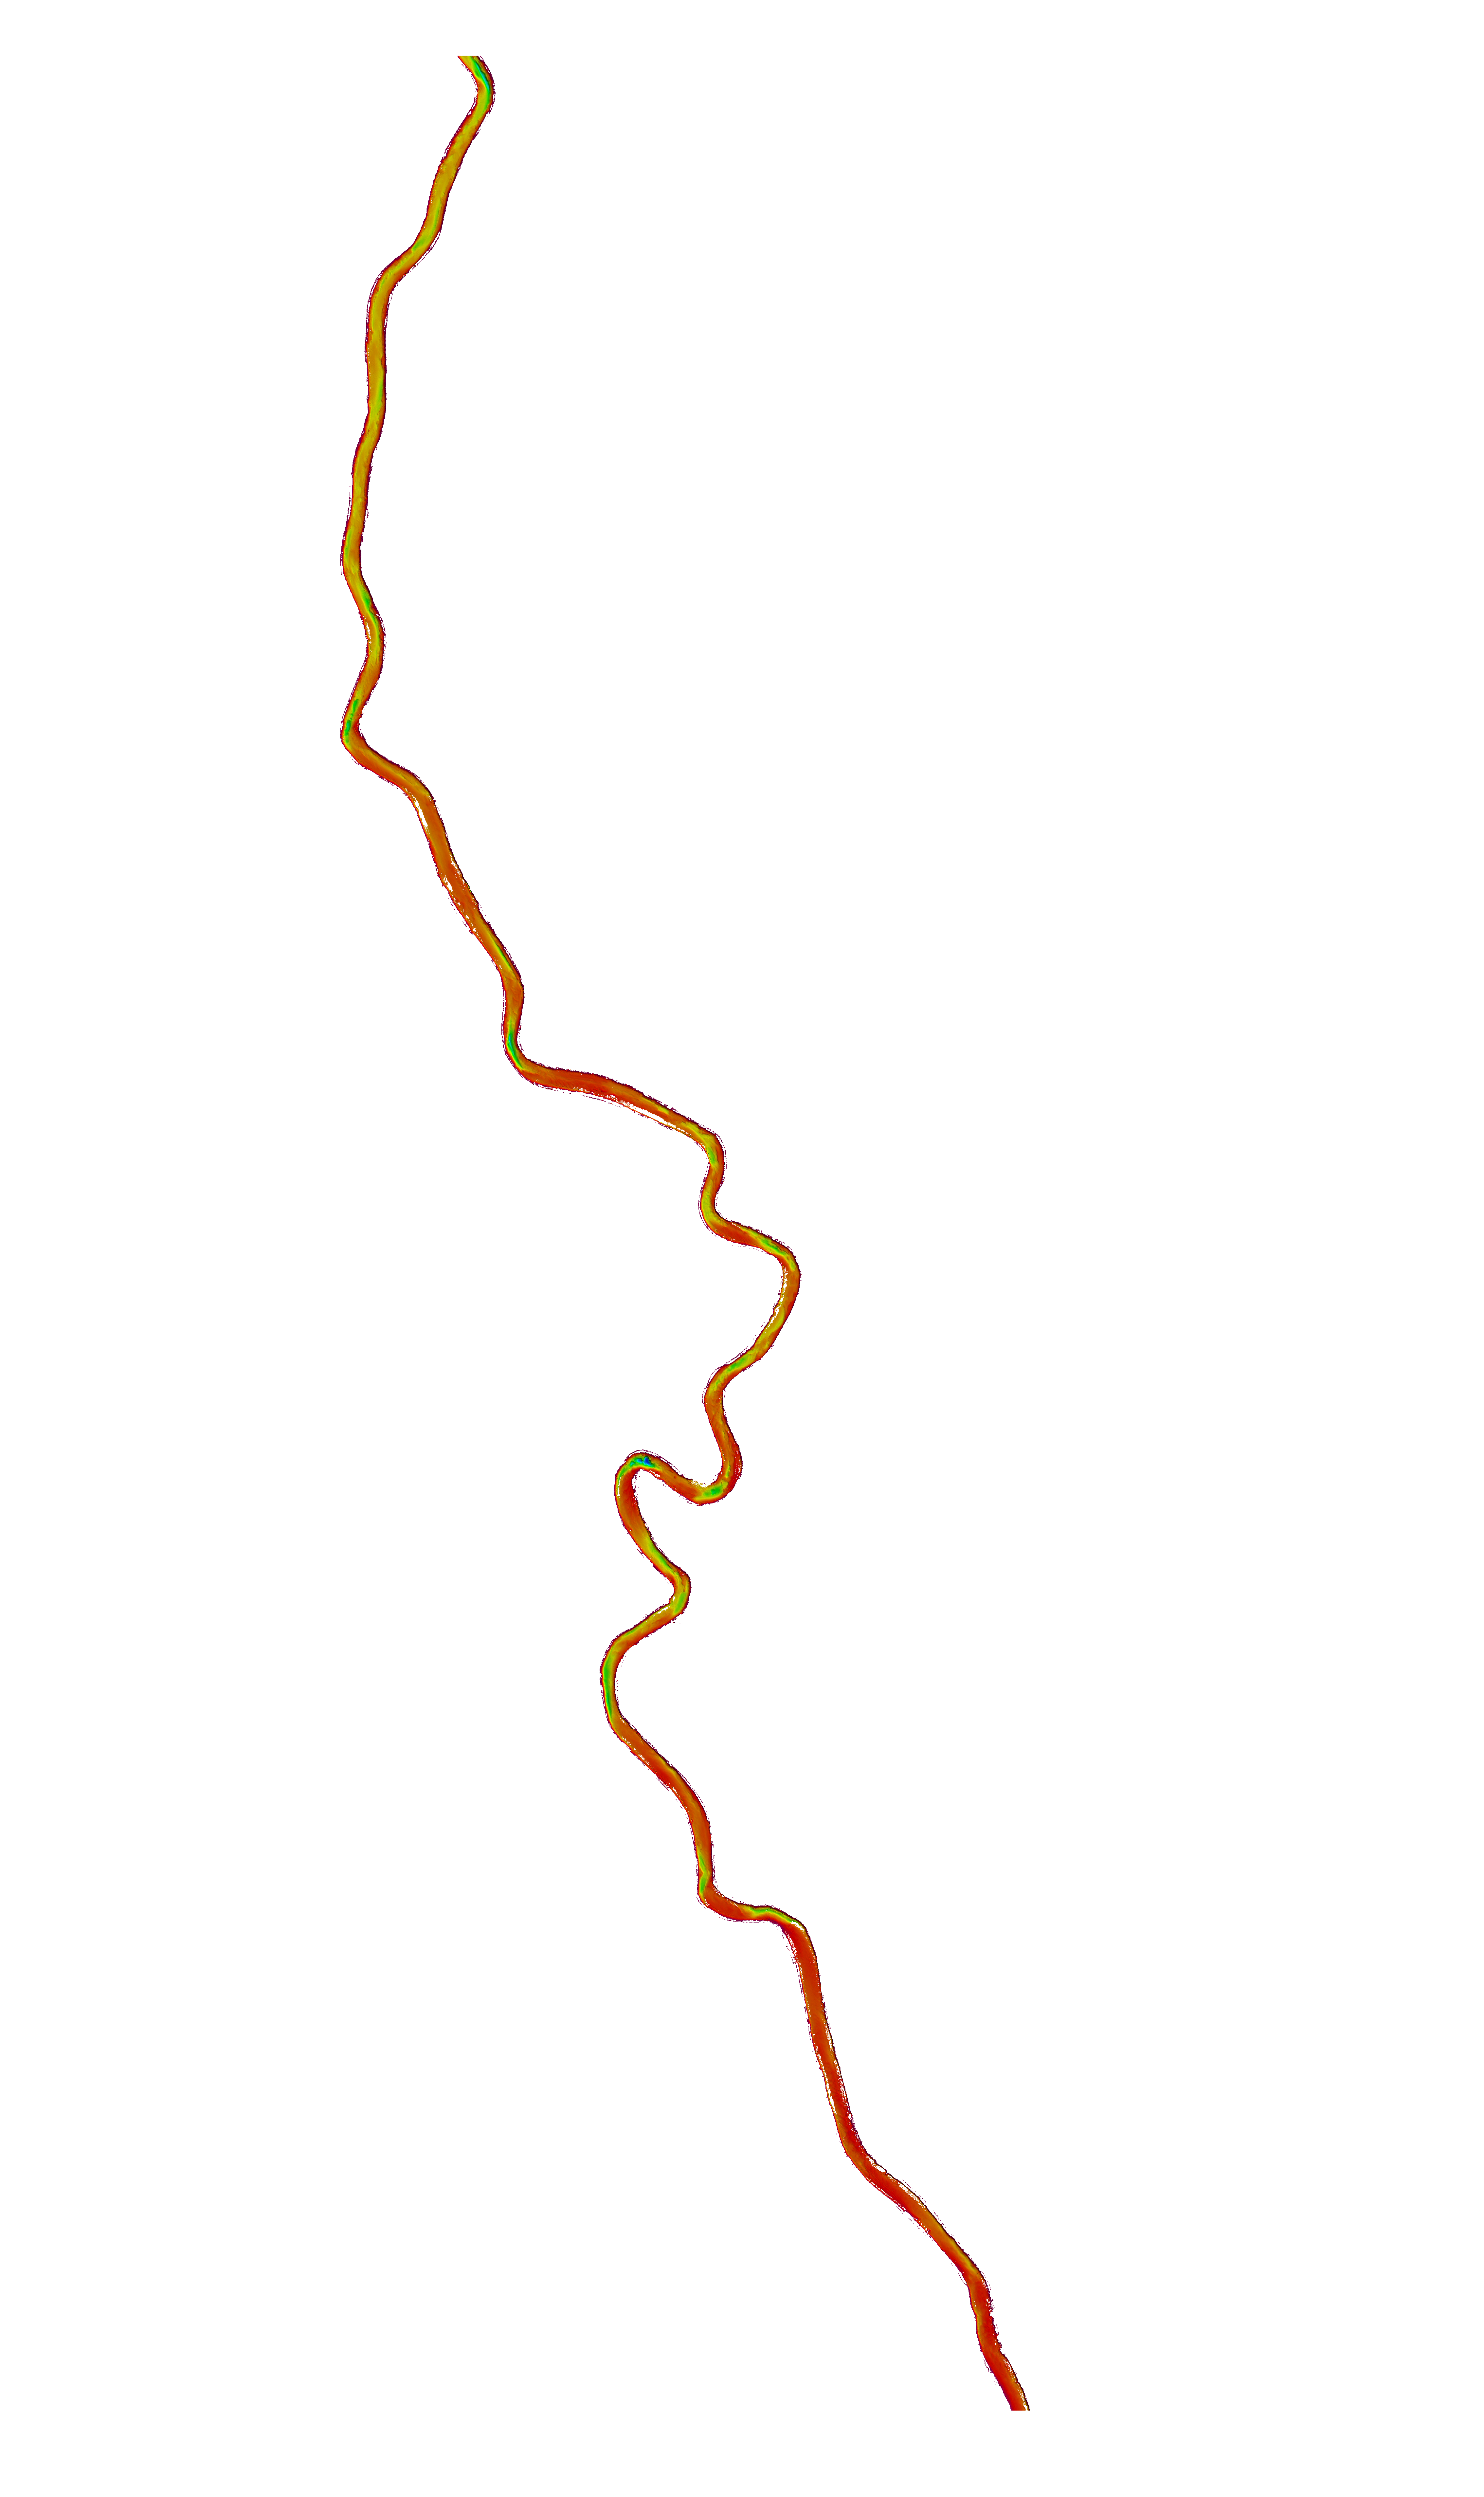
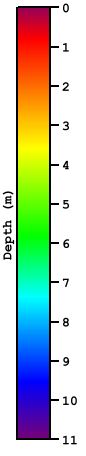
SAN JOAQUIN RIVER BATHYMETRY
These data are NOT to be used for navigation.
Bathymetric data from surveys using Kongsberg Mesotech M3 multibeam sonars during 2015. Below are links to geotiff images, arc binary grids, metadata, and legends for the study area between Port of Stockton and Mossdale, California.
Datasets
Geotiff images of bathymetry
Depth-encoded geotiff
Full River (7-MB zip file)
Colormapped, hillshade images
Northern Reaches (7-9; C3, R3, A3) geotiff image * preview
Central Reaches (4-6; C2, R2, A2) geotiff image * preview
Southern Reaches (1-3; C1, R1, A1) geotiff image * preview
Legend for 1-m geotiffs
Arc binary grid Full area, zipped file with binary grid (.flt), projection (.prj), and header (.hdr)
Metadata for bathymetry surfaces
Contact David Demer for more information

