Remember when counting fish used to be as simple as "one fish, two fish, red fish, blue fish"? With respect to Dr. Seuss and children everywhere, the work of NOAA Fisheries scientists is a bit more complex. They need to collect accurate and timely data on the location, population size, age structure, and identity of the fish they catch. This information goes into scientific assessments that support fishing rules, making sure that U.S. fisheries are sustainable and healthy, and that local seafood stays on our plates for generations to come.
Fisheries data collection has evolved considerably in the past 50 years. From notes on a clipboard to conveyor belts that help sort fish, here's a look at how technology has transformed fisheries sampling on the high seas.

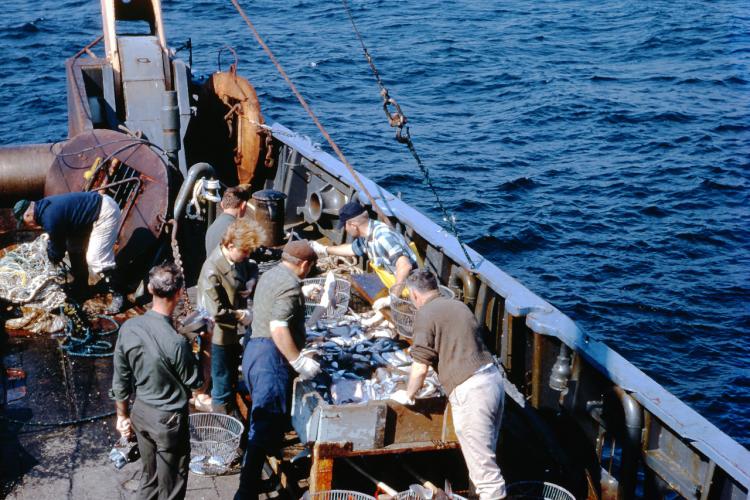
Scientists used pen and paper to collect information about fish aboard the NOAA Ship Albatross IV in the 1960s. Here, fish are caught and dumped from the net into the "checker", where the scientists sort the fish by species and take basic measurements. These paper tallies were often conducted at the mercy of the elements, as wind and waves drowned out voices.

Dr. Robert Edwards separates species aboard the NOAA Ship Albatross IV circa 1960s.
In another 1960s photo from the NOAA Ship Albatross IV, Dr. Robert Edwards, who later became the director of the Northeast Fisheries Science Center, separates different species brought aboard. Working with clipboards of paper logs like the one seen here sometimes introduced errors with transcription, coding, and units of measurement, something addressed in the following decades by advances in shipboard sampling.

By 2010, technology transformed the way scientists gathered critical data about fish populations as seen here in the onboard laboratory of the NOAA Ship Henry B. Bigelow. The lab is inside, protected from the elements. The fish move from the deck to the lab via a conveyor belt. As the fish pass by the scientists, they are sorted by species, weighed, and moved to the sampling stations, all from a series of conveyor belts. This well-designed system saves time and energy and improves accuracy. The lab technology "makes the lab do the work for us," says fisheries biologist Nancy McHugh, "instead of scientists trying to lug a 40-pound basket of fish in rough seas."

Once a fish arrives at the two-person sampling station on the Bigelow, the technological advances stand out on a smaller scale. From the barcoded buckets that display species information on the overhead monitors to a magnet on the sampler's finger used to capture the length of the fish, each aspect of the sampling station uses smart technology to make data collection more precise. The software used to record the data will even alert the sampler if a measurement seems unusual and ask the team to double check it, performing quality control that a clipboard never could.
This kind of technological innovation helps scientists study fish in new ways. From "smart labs" designed around a central conveyor belt to magnetized measurements to determine fish length, NOAA's investment in tech is paying off. The critical data gathered aboard fisheries research vessels provide important information to managers about the size and status of key fish populations, supporting a $244.1 billion fishing industry and 1.74 million jobs in the United States in 2017. With all this in mind, we cannot help but wonder: where will the next 50 years take us?