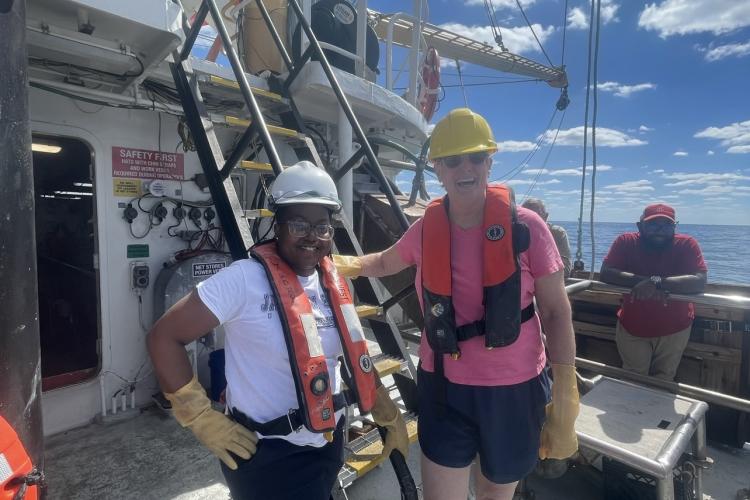
When it comes to any research survey, there are a lot of moving parts required to make sure data collection and operations run smoothly and efficiently. That’s definitely the case for the Fall Groundfish Survey, which wouldn’t be possible without the many crew members, officers, and scientists on board. “Working together as a team is extremely important because you’re only going to be as strong as your weakest link, but I’ve never been out here on a survey when everyone hasn’t pulled their weight,” says Beverly Barnett, research fisheries biologist. The NOAA Ship Oregon II has been the primary sampling NMFS platform for both the Fall and Summer Groundfish Surveys in the Gulf of Mexico.
Preparing for the Groundfish Survey
Before embarking on the first leg of every survey, there is a 90-day planning period. We review protocols, recruit volunteers, and send gear requests (trawl nets and doors that are needed for the duration of the survey). All of these steps must be completed before sailing. “You don’t get to complete one phase before moving on to the next. It’s a continuum that starts 90 days before the survey,” says Alonzo Hamilton, fisheries biologist and field party chief of the Fall Groundfish Survey. “You get your draft instructions put together, then the branch chief and the division chief approve it. Next, you submit that document to NOAA Marine and Aviation Operations for their approval. If they have a concern about meeting a scientific need, that’s when we try to come up with an alternative. All of that takes place in that 90 day window. It’s a living, breathing time period in terms of preparation. As you draw closer to the departure date, the last 30 days are all about finalizing people, equipment, and protocols.”
Selecting Sample Stations

If any gear is damaged at a specific station, we remove that location from the sampling universe. We document it so that future surveys don’t run into the same issue. We don’t sample with trawl gear at known locations of natural or artificial reefs, oil rigs, marine protected areas, habitat areas of particular concern, fish havens, or national marine sanctuaries. We do have other gears in our survey portfolio such as cameras that do sample on these structures.
Getting to Work
Once we’re underway, it’s time to start working! Data collection and processing take place continuously 24 hours per day, so shifts are separated into two 12-hour shifts. Half of the crew members and scientists are on the day shift (12 p.m.–12 a.m.) and the other half are on the night shift (12 a.m.–12 p.m.). The amount of stations that each shift completes depends on factors such as weather conditions, gear reliability, and distance between stations. The NOAA Corps team on the bridge, the deck department, and the science department are in constant radio communication. When we’re 10 minutes away from each station, one of the NOAA Corps officers lets everyone know and we start preparing for step one of the process.
Step 1: CTD Deployment

The first step is to deploy an instrument called a CTD (which stands for the main variables it measures: conductivity, temperature, depth) to obtain environmental data throughout the water column. CTDs collect the water column’s temperature, conductivity (salinity), transmissivity (turbidity), dissolved oxygen concentrations and fluorometry. The deck department operates the crane to which the CTD is attached. We first deploy it to the water’s surface to calibrate the sensors. After 5–10 minutes, we lower the CTD down to a specified depth that is chosen by the scientist shift leader. Once measurements are taken at depth, we bring the CTD back up to the surface and onto the vessel to rinse down with fresh water.
Step 2: Trawling

The next step is to set the trawl net in the water. The trawl nets used are standard 42-foot semi-balloon trawls with 8 foot by 40 inch chain doors. During this process, the deck department is communicating with the NOAA Corps Officer on the bridge regarding the depth at which to deploy the trawl, which depends on the depth of the current station. Once we deploy the trawl net, our vessel tows it at 2.5 knots for 30 minutes. Then, it’s time to start hauling back the catch. This part is always full of anticipation and excitement—you never know what kinds of critters you’re going to see! The deck department ensures that there’s nothing wrong with the gear as they’re hauling back, as occasionally the doors can get tangled or the net can rip. At the same time, the science department is preparing baskets to hold the catch, and looking to see how big the catch might be and how dirty we might get (some stations are more muddy than others)!
Step 3: Measuring and Sorting

Once we bring the catch onto the vessel, we transfer it from the trawl net into baskets. We weigh each basket, then bring it into the wet lab. We dump the catch onto a conveyor belt where scientists sort fish and invertebrates by species. We put each species into a separate tray and count them. Throughout this process, the “shift lead,” the scientist in charge of scientific operations during the shift, is usually starting to input species names, and the count and weight of each species, into the Trawl Replacement Input Program. The Trawl Replacement Input Program has 10,440 active taxa stored in its database, of which 5,640 are identified as a species, each with unique identifiers for the number of individuals that need to be measured and sexed. It is equipped with a magnetic measuring board and a scale that sends length and weight measurements directly to the program. We manually input the sex of individual organisms into the program. We’ll go into more detail on this in the next section.
Step 4: Individual Measurements
After we’ve entered all species into the database, it’s time to start taking individual measurements. One scientist inputs information into the program while another notes the length, weight, and sex of each individual organism. We measure length with a measuring board using a magnetic wand with a sensor that sends the measurement directly to the program. The process for determining sex and taking length measurements is different for each species. For example, length is usually measured as either total length, fork length, or standard length.

For bivalves such as scallops, length is measured by measuring the grill to the hinge. For commercially important species such as red snapper, we weigh and record the sex for each individual. For most of the other species, we take measurements and record sex for every fifth individual. Currently, our scientists are testing a new barcoding system to ease the process of data collection. We will learn more about that in the next blog. Stay tuned!
Meet the Blogger

Hannah Shahmoradi
Hannah Shahmoradi is a communications intern with the Directorate at NOAA Fisheries’ Southeast Fisheries Science Center in Miami, Florida. Hannah earned her Bachelor of Science degree in Marine Science at the University of Maine in 2022, and is currently pursuing a Master of Professional Science degree in Marine Conservation at the University of Miami. Hannah’s research interests include social science and human dimensions in marine conservation, behavioral research on marine megafauna, and media development. Meet Hannah.