

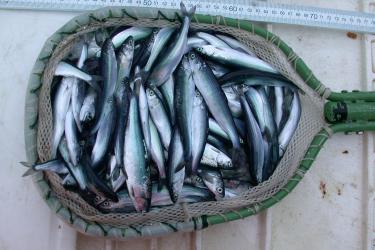
Fisheries researchers working with Atka Mackerel.
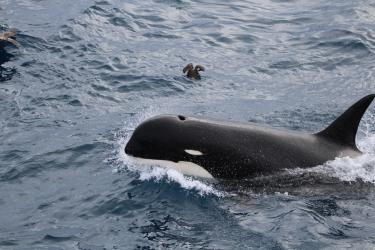
In order to prevent possible prey shortage for the Steller sea lions, the NOAA Fisheries established 20nm no trawl zones around six sea lion rookeries in the eastern Aleutians in 1991. In 1998, further efforts were made to spread out fishing effort temporally as well as spatially. Instead of one season per year for Atka mackerel, an A and a B season were mandated and more quota was assigned to be caught outside of critical habitat. These restrictions affected the fishery severely and the question arose as to the efficacy of the no trawl zones and the impact of the fishery on Atka mackerel. In order to measure the impact, it is necessary to estimate small scale Atka mackerel abundance and potential changes in behavior or movement of Atka mackerel that could be attributed to the fishery. The goal of this project is to use tagging methods to estimate local abundance and small scale movement of Atka mackerel around Steller sea lion rookeries and to examine potential fishery effects on Atka mackerel movement and abundance.
Biomass and movement rates were estimated with an integrated model that uses maximum likelihood to estimate all parameters simultaneously. There were four components of the model including expected tag recoveries, tag loss, tag survival, and tag reporting.

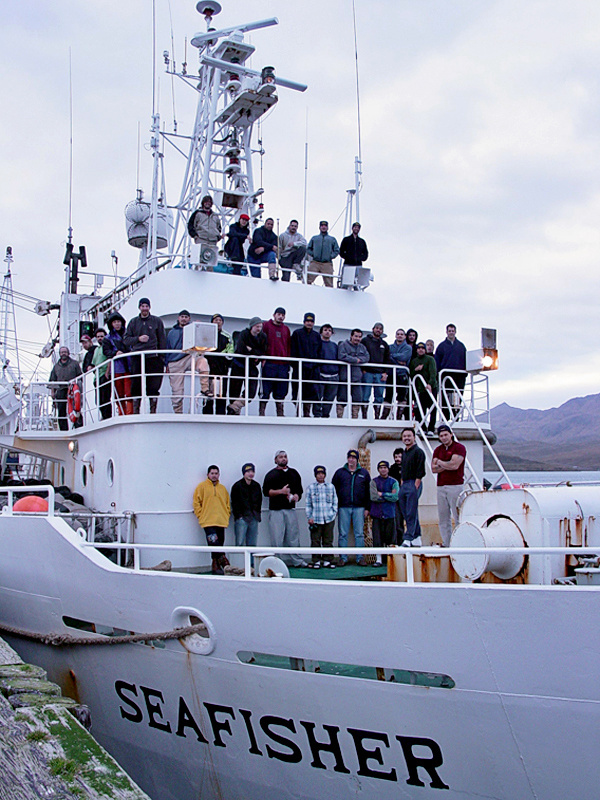
Charter vessel CPUE was estimated from the hauls of the recovery cruise with the Chartered factory trawler Seafisher as the average Catch in tons per hour trawled. The vessel was using commercial fishing gear.
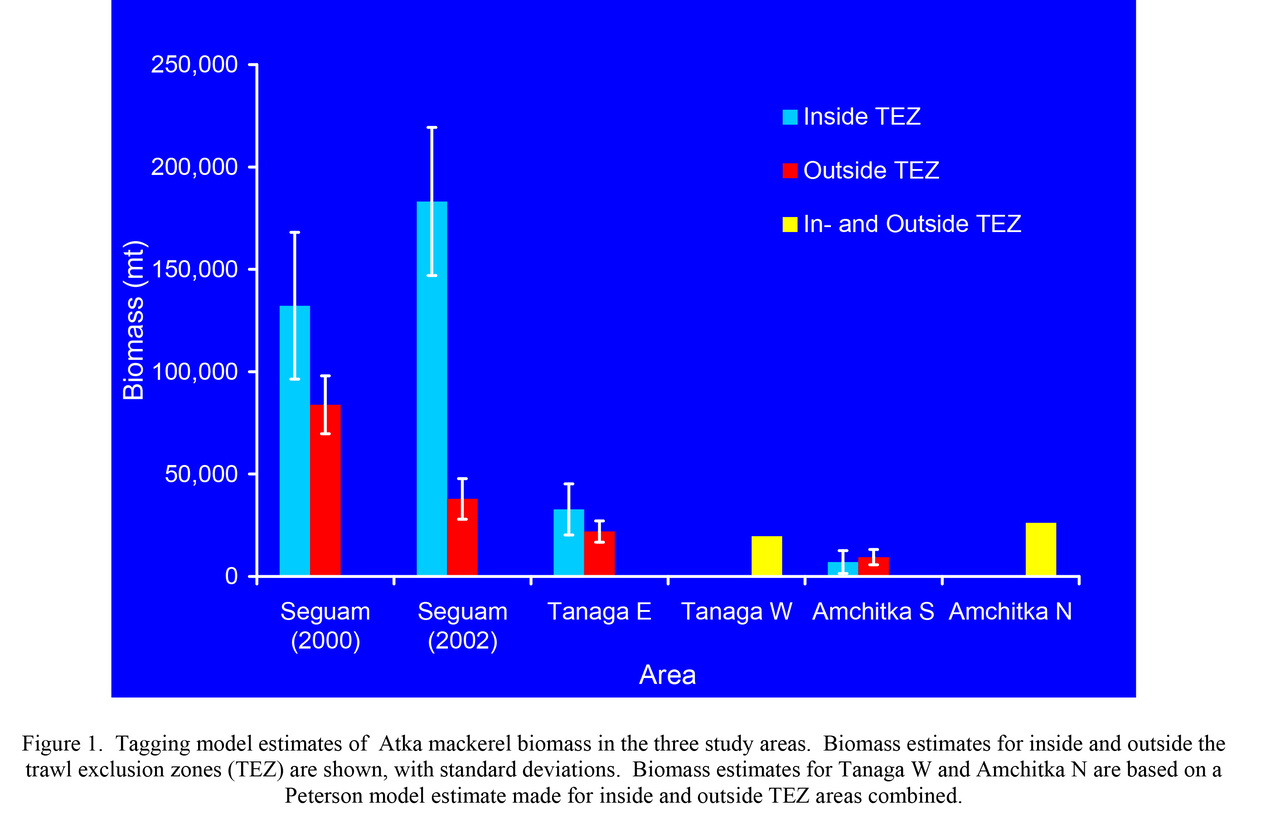
Preliminary results presented here are from the years 2000–2003 and will be updated for 2006 in the near future. Population sizes and biomass were highest at Seguam Pass and lowest at the south end of Amchitka Island and are summarized in Table 3 and Fig. 1, Fig. 2, and Fig. 3. In all areas, biomass inside the TEZs was similar to or greater than biomass outside the TEZs. In all areas, movement rates from inside to outside were similar to or less than movement rates from outside to inside, with the exception of Amchitka Island where movement rates may have been greater from inside to outside. In addition, movement rates were greater overall at Amchitka Island than at any of the other study areas. Population estimates for Amchitka Island north and Tanaga West were estimated for inside and outside the TEZ’s combined since the model could not estimate population size for the areas separately.
Vessel CPUE was highest at Seguam Pass and lowest at Amchitka and seemed to show the same trends as the population estimates. CPUE (tons of Atka mackerel caught per hour) only reflects the fish density in the sampled hauls. It does not take into account the differences in geographical size of the habitat. Therefore it seems reasonable that CPUE is about three times as high in Seguam as it is in Amchitka, even though population estimates are more than ten times as high. The geographical area of Atka mackerel trawlable habitat at Seguam pass is much larger than the one at Amchitka which is reflected in the larger population size.
These results suggest that TEZs in Seguam and Tanaga Passes, where Atka mackerel biomass is relatively high and movement is relatively low, may be effective at preserving local foraging areas for SSL. In contrast, the TEZ at the south end of Amchitka, where biomass is low compared to other areas and movement is high, may be less effective. These differences in movement relative to TEZs may be due to differences in the distribution of Atka mackerel habitat. For example, the boundaries of the TEZs at Seguam and Tanaga passes appear to coincide with natural Atka mackerel habitat boundaries (by chance). In contrast, the TEZs at Amchitka Island, appear to bisect Atka mackerel habitat. This may be why movement rates relative to TEZ boundaries at Amchitka were higher than at Seguam and Tanaga passes.