Researchers are curious to see if they will come across a “cold pool” during this year’s annual Southeastern Bering Sea Shelf Bottom Trawl Survey given the unusually warm winter and the limited sea ice coverage in 2017/2018. They suspect they might not, and that would be a first.
The “cold pool” is a large mass of frigid water, which has a mean temperature of less than 2 degrees C (36 degrees F). It forms near the ocean bottom across the eastern Bering Sea shelf in those areas covered by ice as the ice melts in the Bering Sea and the Gulf of Anadyr. The Gulf of Anadyr is in Siberia and represents the northeastern extent of the Bering Sea.
Why do we care about the cold pool? The cold pool plays an important role in the Bering Sea ecosystem. It serves as both a barrier and a haven for fish distribution. For some fish such as arctic cod the cold pool is a refuge for feeding and spawning, while for others such as pollock and Pacific cod, the cold pool is a barrier to movement across the eastern Bering Sea shelf and to the north, towards the Bering Strait. Declines in abundance of the arctic snow crab over the southern portion of the shelf have been attributed to the gradual warming of waters there. Similarly northerly range expansions of other species have been attributed to the decreasing southerly extent of cold bottom water.
The “Cold Pool” During Previous Surveys
The survey, now in its 37th year, starts in early June and runs through August. During the survey, scientists collect biological information on commercially important fish, crabs and other species. This information is used to help determine fish and crab stock abundance and serves as a basis for resource management decisions. Key species surveyed include: Alaska “walleye” pollock, Pacific cod, Greenland turbot, yellowfin sole, northern rock sole, red king crabs, snow crabs and Tanner crabs.
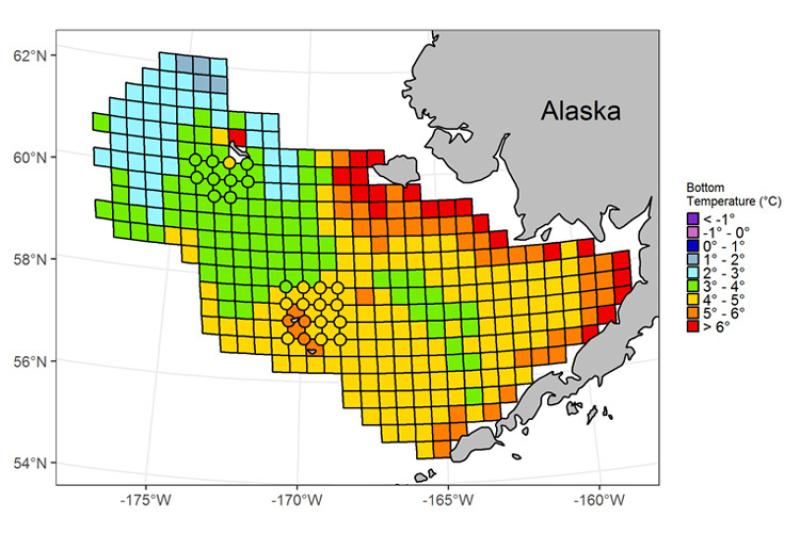
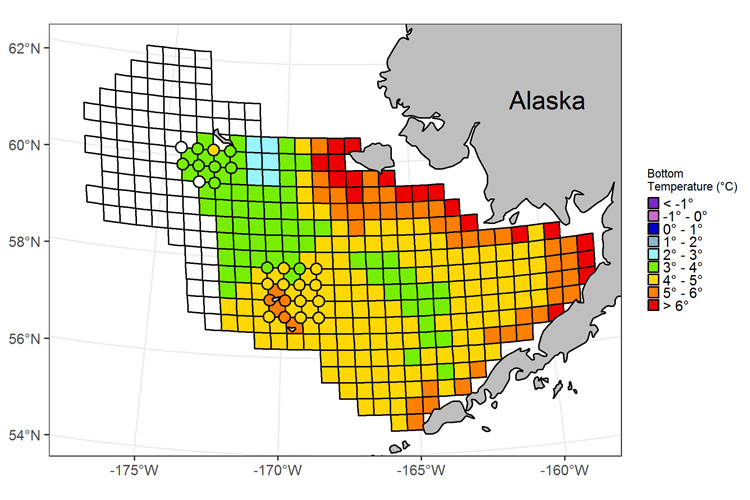
“We also collect a variety of oceanographic information such as ocean bottom temperature from all the “survey stations” where we sample. Last year our bottom temperature data were interesting in that we encountered the “cold pool” pretty far south. It extended from the U.S.–Russian boarder all the way to the western edge of Bristol Bay,” said Bob Lauth, Survey Coordinator at NOAA Fisheries’ Alaska Fisheries Science Center.
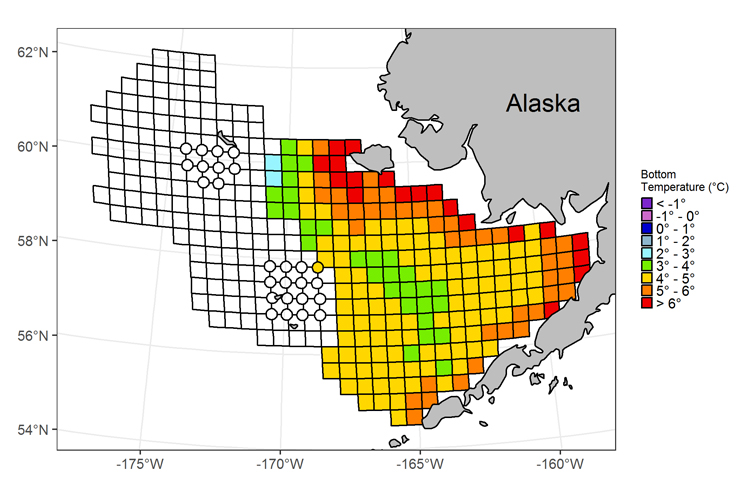
According to Lauth, the southward extent of the cold pool was a bit of a surprise because of ocean conditions prior to the survey. On average warmer than normal sea surface and bottom temperatures occurred during the summer of 2016. As a result when winter began, sea ice coverage along the shelf was limited.

Ocean bottom temperatures during 2016 Eastern Bering Sea Shelf Bottom Trawl Survey.
“We would have expected to see a smaller cold pool during our 2017 survey, like we did during 2016 (see map above) since winter water temperatures were warmer than average. But that didn’t happen because there was a late winter freeze and melt that set up the cold pool,” said Lauth.

Ocean bottom temperatures during 2017 Eastern Bering Sea Shelf Bottom Trawl Survey.
The last survey year where the cold pool extended so far south was in 2012, which was a year with colder than average ocean bottom temperatures during the winter months in 2011/2012.

During the winter of 2011/2012 water temperatures on the bottom were colder than normal and the Gulf of Anadyr and Bering Sea saw broad sea ice coverage. As expected, when scientists returned to the Bering Sea in the summer of 2012 to conduct their annual survey, they saw an extensive cold pool.
What Will Ocean Bottom Temperatures Look Like in 2018?
Will there be more surprises this year?
“We’re particularly curious about what we will see when we get on the water,” said Lauth. “We may not even see a cold pool in the survey area this year, given how warm our winter was and the fact that the Gulf of Anadyr didn’t fully freeze.”
That would be a first in the history of the survey. It also likely would affect the distribution of fish species, which would have implications for the commercial fisheries and local communities that harvest these species.
“Collecting long-term data so we can understand better the complexities and relationships in marine ecosystems is critical for sustainable resource management,” said Lauth.
Over the course of the 2018 survey as they did last year, the field team plans to provide regular updates on bottom temperatures recorded at each survey station. Be sure and check back here to read the latest news from this survey. Our sampling will reveal the prevailing bottom temperatures across the entire southeastern Bering Sea shelf, a large area similar in size to the state of California.

Analysis of means of near-bottom temperatures recorded during the Eastern Bering Sea Continental Shelf Bottom Trawl Survey for each of the years between 2001 and 2017.The red region represents the 95% decision limits around the grand mean (UD is the upper limit and LD is the lower limit).
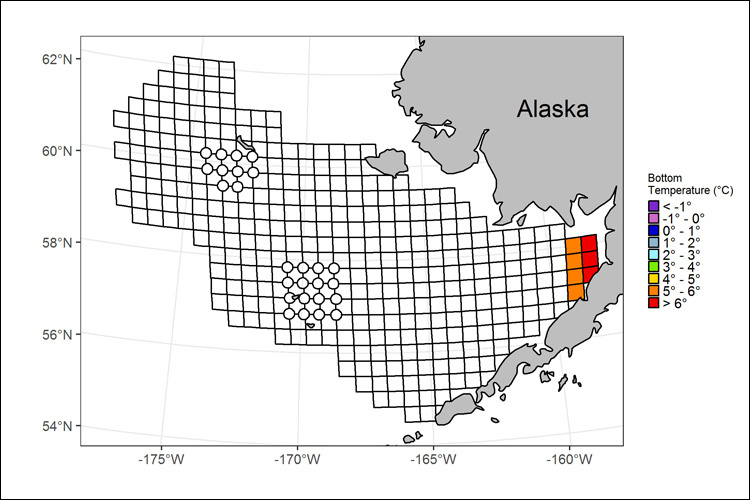
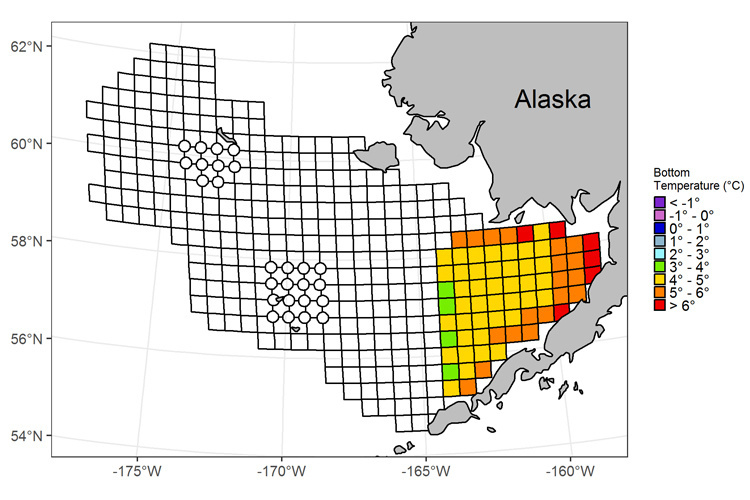
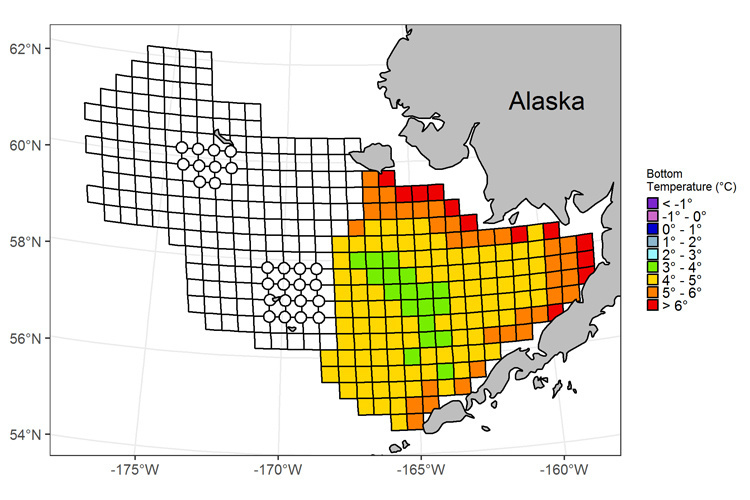
2018 Survey Maps

|
||

|


Additional Resources
- Scientific Teams Set Out to Track Unprecedented Changes in the Eastern Bering Sea
- 2019 Southeastern Bering Sea Shelf Bottom Trawl Survey Gets Underway
- 2017 Eastern Bering Sea Shelf Survey - Post 1
- 1982-2006 Eastern Bering Sea Water Column Temperature Data
- The 2018 Eastern Bering Sea Continental Shelf and Northern Bering Sea Trawl Surveys: Results for Commercial Crab Species
- The 2017 Eastern Bering Sea Continental Shelf and Northern Bering Sea Bottom Trawl Surveys: Results for Commercial Crab Species
- Scientific Paper: Bottom Trawl Surveys in the Northern Bering Sea Indicate Recent Shifts in the Distribution of Marine Species


