Researchers returned to sea for the second ecosystem monitoring (EcoMon) cruise of 2021. Scientists and crew aboard the NOAA Ship Pisces sampled at 149 stations. They achieved near-complete coverage of the survey area, from north of Delaware Bay through the Gulf of Maine.

Fewer days were available for the cruise than originally planned. The scientific crew dropped all stations south of Delaware Bay at the beginning of the cruise to allow for full coverage in the north. Favorable weather and sea conditions during the entire survey allowed for supplemental stations to be added on the end of the cruise. Sample stations were added adjacent to Nantucket Shoals, near foraging North Atlantic right whales and in and around wind energy lease areas.
Zooplankton are tiny animals and very young stages of some animals that will grow larger. Samples of zooplankton provide information about the food chain supporting fisheries and marine mammals. Scientists use larval fish and egg samples to learn more about fish stock spawning and help estimate stock abundance. Measurements of physical and chemical conditions like temperature and salinity help us describe ecosystem productivity, spawning, larval recruitment, fish condition, and species distributions.
Together, the core measurements conducted by our EcoMon cruises help researchers understand and predict changes in the Northeast shelf ecosystem and its fisheries. Researchers are scheduled to sail on the next EcoMon survey in October aboard the Pisces.

Core Sampling Summary
Plankton Collection
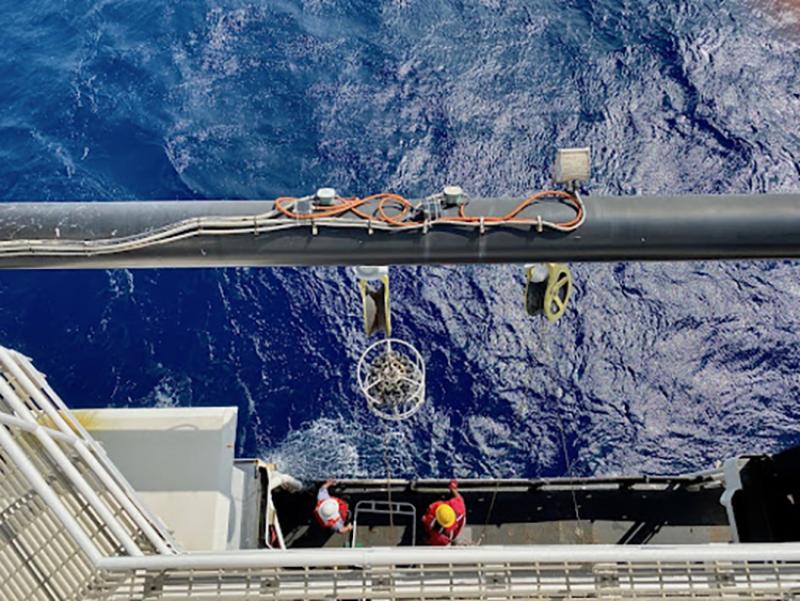
Core EcoMon sampling includes “bongo” net tows to collect zooplankton, larval fish, and fish eggs. These fine-mesh nets are attached to side-by-side steel rings, resembling bongo drums when deployed. During this survey, bongo net tows were conducted at 133 different stations. Samples from this survey will be used to update an index of plankton forage for the 2022 State of the Ecosystem report.

Conductivity, Temperature, and Depth Profiles
Seawater conducts electricity. The level of “conductivity” varies by depth and other oceanographic factors and is used to estimate the salinity of seawater. At all 149 stations, the crew deployed an instrument that can measure conductivity, temperature, and depth. The combination of temperature and salinity at various depths helps define marine habitat boundaries, track ocean circulation, and monitor changes in climate. This can help explain changes in marine species distribution and productivity.
Ocean Acidification Monitoring
To monitor marine carbon cycling and ocean acidification, scientists collected water samples and measured dissolved inorganic carbon, total alkalinity, pH, and nutrients at 28 stations. Increases in dissolved carbon dioxide can increase acidity of the water, which can in turn affect shellfish and other organisms that are particularly sensitive to the acidity of ocean water.
Special Collection Summary

Our EcoMon program collaborates with other agencies and institutions to support research that enhances core EcoMon sampling. While COVID-19 mitigation protocols limited external participation on this survey, the summer 2021 EcoMon cruise included sampling for several ongoing projects with external partners.
Protected Species
Two observers were aboard to watch for and record data on seabirds, marine mammals, and sea turtles encountered along the cruise track. This is part of the Atlantic Marine Assessment Program for Protected Species, a partnership among scientists from NOAA, the U.S. Fish and Wildlife Service, the Bureau of Ocean Energy Management, and the U.S. Navy.
Phytoplankton
An imaging flow cytobot was deployed aboard the ship and used to image and count phytoplankton cells continuously from surface waters during the ship’s transit. This work is part of a National Science Foundation project led by Woods Hole Oceanographic Institution with collaborators from the University of Massachusetts Dartmouth, the University of Rhode Island, Wellesley College, and NOAA Fisheries.
eDNA
Environmental DNA sampling was conducted to test the technique as a way to monitor finfish by detecting genetic material they shed in the water column.