Thanks to a combination of favorable weather and a well-run vessel, the 2019 Northeast summer ecosystem monitoring (EcoMon) survey aboard NOAA Ship Gordon Gunter sampled at 136 stations.
Fewer days were available for the cruise than originally planned. Researchers curtailed coverage in North Carolina waters, the Scotian Shelf and nearshore off coastal Maine to maximize use of available time. Five stations were dropped on Georges Bank due to weather.
Together, the core measurements conducted by EcoMon cruises help researchers understand and predict changes in the Northeast ecosystem and its fisheries. Researchers set out on the next EcoMon survey in October aboard NOAA Ship Gordon Gunter.

Core Sampling Summary
Plankton Collection
The long-term EcoMon sampling includes “bongo” net tows to collect zooplankton, larval fish, and fish eggs. Fine-mesh “bongo” nets attached to side-by-side steel rings, which looks kind of like bongo drums when deployed. Researchers conducted bongo net tows at 121 different stations.
Samples collected using the towed nets include fish larvae, fish eggs, squid paralarvae, and zooplankton (tiny animals, mainly crustaceans, and very young stages of some larger ones). Zooplankton provide information about the food chain supporting fisheries and marine mammals. Scientists use larval fish and egg samples to learn more about fish stock abundance.
Conductivity, Temperature, and Depth Profiles
Seawater conducts electricity. This “conductivity” is used to estimate seawater salinity. The crew deployed an instrument that can measure conductivity, temperature, and depth—shortened to CTD—at all 136 stations on this survey. The combination of temperature and salinity at various depths helps define marine habitat boundaries, track ocean circulation, and monitor changes in climate. This can help explain changes in marine species distribution and productivity.
Ocean Acidification Monitoring
To monitor marine carbon cycling and ocean acidification, scientists collected water samples and measured dissolved inorganic carbon, total alkalinity, pH and nutrients at 23 stations. Increases in dissolved carbon dioxide can increase acidity of the water, which can in turn affect shellfish and other sensitive organisms. The NOAA Ocean Acidification Program funded this work, conducted in partnership with NOAA’s Atlantic Oceanographic and Meteorological Laboratory in Miami.
Special Collection Summary
The Northeast Fisheries Science Center’s EcoMon program collaborates with other agencies and institutions, supporting research that enhances core EcoMon sampling. The summer 2019 EcoMon cruise included sampling to support ongoing projects with the University of Rhode Island, the Woods Hole Oceanographic Institution, the Department of Fisheries and Oceans Canada, the Bureau of Ocean Energy Management, the U.S. Fish and Wildlife Service, and a variety of groups within NOAA. Specifically:
-
Ring nets were deployed alongside standard EcoMon bongo nets during tows at a subset of stations to compare the samples collected. The Department of Fisheries and Oceans Canada’s Atlantic Zone Monitoring Program uses ring nets for plankton sampling. This experiment is part of the work we are doing to find ways of combining data collected by each country in the Gulf of Maine and Georges Bank.
- University of Rhode Island scientists are leading a project to better identify sizes and types of phytoplankton using ocean color measurements derived from satellite images. These researchers took optical measurements to support the development of regional algorithms for this project. NOAA’s Joint Polar Satellite System Proving Ground and Risk Reduction Program funded the work. Partners include researchers from NOAA and the Woods Hole Oceanographic Institution.
- Two observers were aboard to watch for and record data on sea birds, marine mammals, and sea turtles encountered. This is part of the Atlantic Marine Assessment Program for Protected Species, a partnership among scientists from NOAA, the U.S. Fish and Wildlife Service, the Bureau of Ocean Energy Management and the US Navy.
- An imaging flow cytobot was aboard the ship and used to image and count phytoplankton cells continuously from surface waters during the ship’s transit. This work is part of a National Science Foundation project led by Woods Hole Oceanographic Institution with collaborators from the University of Massachusetts Dartmouth, the University of Rhode Island, Wellesley College, and NOAA Fisheries.
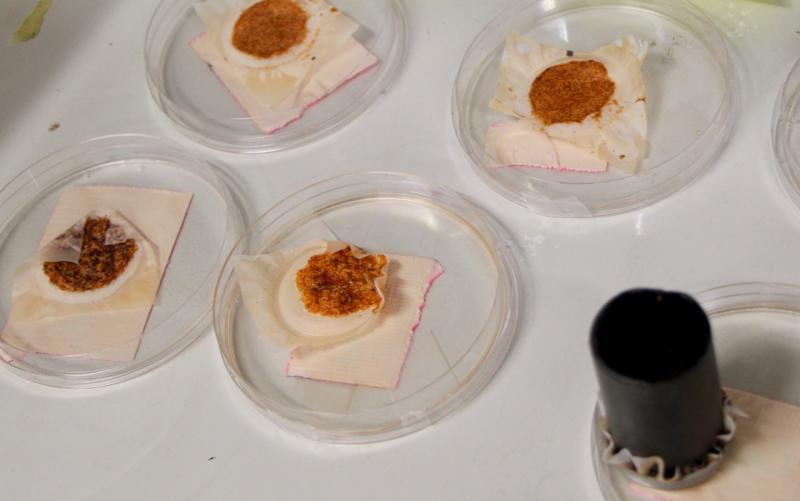
- Samples were also frozen and dried from our net collections for researchers from University of Maine, Florida Fish and Wildlife Research Institute, and University of Massachusetts Amherst for stable isotope analyses. Stable isotope analysis of elements such as carbon, nitrogen, and sulphur can help identify what fish and seabirds are eating or even reconstruct in what oceanic temperatures plankton like to live.