Last fall, I participated in Leg 2 of our Bottom Trawl Survey aboard the NOAA ship Henry B. Bigelow, marking the 60th anniversary of this survey. Leg 2 lasted 3 weeks and I looked forward to a break from the office to reconnect with the fieldwork, the fish, and the fabric of life at sea. As a biologist in the Population Dynamics Branch, I also wanted to refresh my memory and appreciation for the data collection that occurs on the survey, particularly as it relates to stock assessments.

A stock assessment is a critical tool that managers use to identify how many fish can be harvested every year without depleting the population. Conducting an assessment involves estimating past, current, and future stock sizes. To understand the forces at play, scientists often develop mathematical models. Data from our survey are crucial for stock assessments.
During the survey, we sample and collect data at a series of predetermined stations. It starts with the ship crew conducting Conductivity, Temperature, and Depth (CTD) sampling to record water column properties. Some stations are also sampled for plankton and larval fish using a bongo net. This provides habitat characteristics and oceanographic conditions over space and time, which contribute to a greater understanding of the state of the ecosystem and provide useful insight for stock assessments.
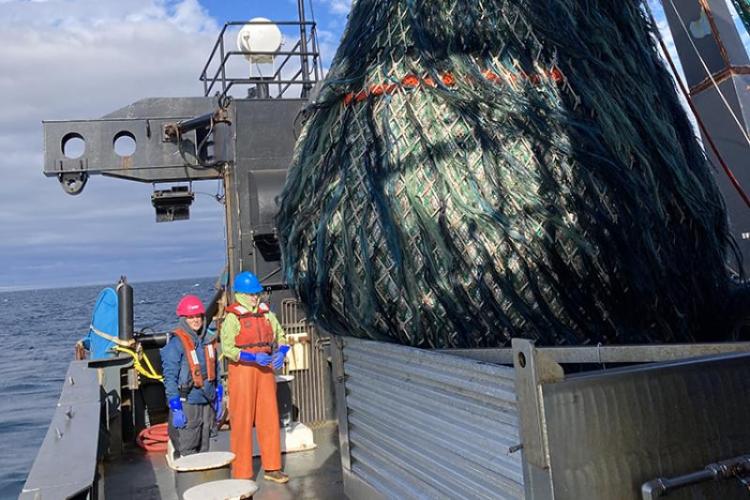
Next, we start fishing tows and use instruments to record measurements of gear performance. Using the width of the opening, along with the precise tow time and vessel speed, scientists can determine exactly how much ocean bottom was sampled. This helps us obtain a more precise estimate of catch rate.

Once the tow is complete and the fish arrive onboard, we start by separating the catch and record total weights for each species. We then transition to collecting data and biological samples from all individual fish, or a portion if we caught a large amount of one species. Here, we measure each organism and, depending on the protocol, we may take otoliths, determine sex and maturity (reproductive) status, evaluate stomach contents, or fulfill requests from other researchers. We also record the weight of each sampled organism.
Catch data provides all kinds of information for stock assessments. The average number of fish caught in a tow provides a measure of relative abundance. Because the survey is standardized—conducted in the same way year after year—we can compare these numbers between years and learn about trends over time. Doing the same with the average weight of fish caught each year tells us about changes in biomass.

Biological sampling provides the basis for learning about the key processes that cause changes in stock size. Any population will increase or decrease when individuals join or leave it, so knowing about births and deaths is fundamental. However, knowing what happens during life is also important.
Combining the individual length, weight, and age data, one can ask:
- How do fish grow?
- Are the fish in good physical condition?
- How many small and large (or young and old) fish are there?
Adding in sex and maturity data tells us about reproduction, for example:
- How many males and females are there?
- At what age or size do they begin to reproduce?
- When and where do they spawn?
Finally, stomach content records shed light on the diet and relationship between species.
Looking at the entire series of data, scientists can consider all of these questions in terms of how these processes may change over time and across our region.
A stock assessment is essentially a complex accounting exercise to track all fish coming in and out of the population and understand the forces that drive change. While fishery-dependent data tell us about harvested catch, long-term fishery-independent data—such as the data collected on the bottom trawl survey—are invaluable to understand the other pieces of the puzzle and support sustainable fisheries management.