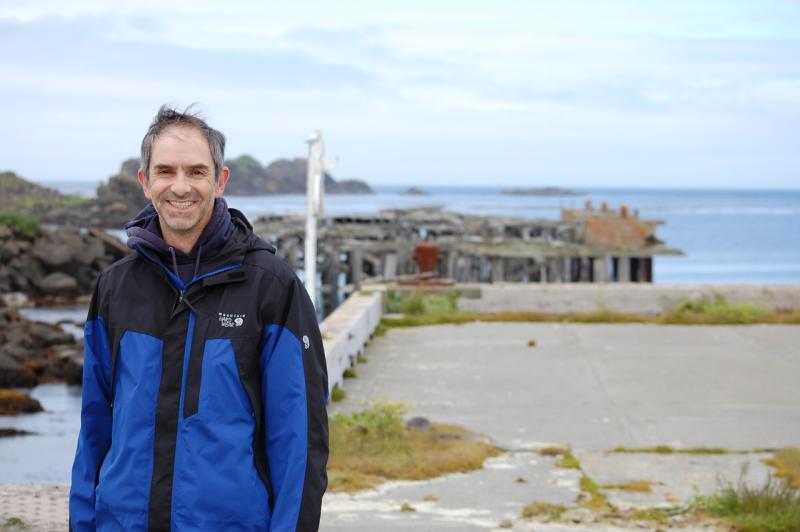
When did you know you wanted to be a fisheries scientist?
I trace my interest in fisheries back to my childhood, hiking and fishing for trout in Yosemite National Park in California. Another strong influence was a summer job at a salmon processing plant in Alaska during college. After graduating from college, I found myself sitting on the floor of the Fisheries and Oceanography library at the University of Washington. I was surrounded by books and journals that I had pulled off of the shelves, sneezing from the dust, reading fisheries research, and developing my own ideas.

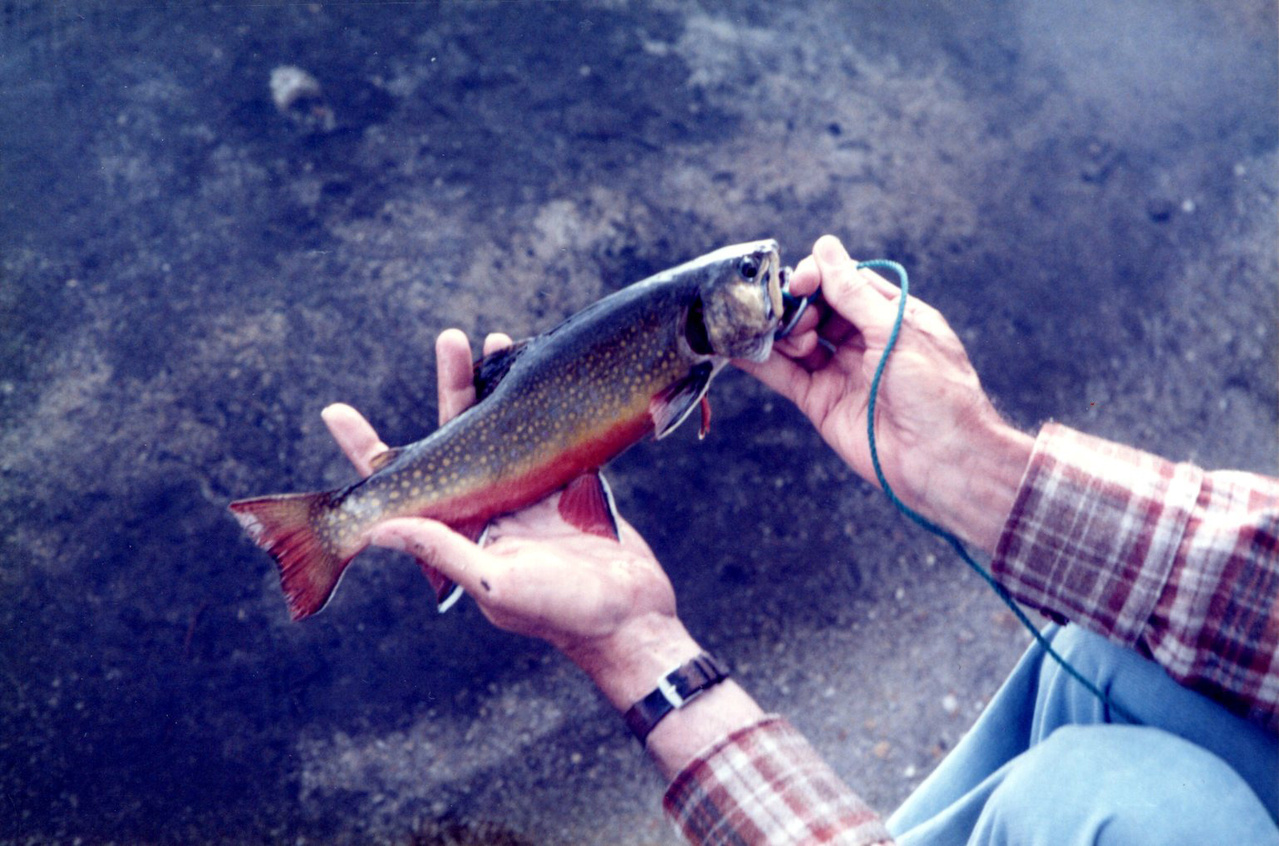
As a dedicated but young trout fisherman in the high country of Yosemite, I always carried a topographic hiking trails map with me. I was constantly unfolding the map and comparing its image of the landscape to what I was seeing at my location. What were the names of the surrounding mountain peaks, if they were named? When did the trail reach the topographic lines that indicated flat walking? How did the rivers and streams connect the lakes and ponds, where some forgotten trout (especially eastern brook trout and brown trout) might be waiting for me to catch them? Hiking through the landscape, I linked the terrain that I experienced to the points, lines, and polygons on my cherished and tattered map. It forever cemented in my mind the map as a way to organize all of that spatial information.
In my career studying the groundfish of Alaska, I have returned to the map as a way to organize information. This time the map is electronic, built with Geographic Information System (GIS) software on a computer, and I am creating the map rather than just consulting it. Instead of a paper map being folded and unfolded, with the electronic map I am constantly zooming in and zooming out, adding and subtracting data sets, changing the color scheme, and examining data sets in different ways. I’m looking for errors, trends, and gaps as I try to build my own image of the seafloor of Alaska. It’s not the same as Yosemite, but the fish are often bigger than what we caught in those cold, alpine lakes.


What are your greatest challenges?
The limits of tools, data, and time are my biggest challenges. Trying to make a detailed and accurate map of the seafloor of Alaska is like trying to paint the Golden Gate Bridge with a hand-held brush and a small can of paint. If you were ever able to finish the whole structure from one end to the other, so much time would have passed that you’d need to start over again.
No other area in the U.S. EEZ is as dynamic, vast, complex, and difficult to map as the Alaska seafloor. It has active faults, scouring and heavy sedimentation, volcanic eruptions and resultant ash accumulations, extreme tides and currents, shifting sand waves, isostatic rebounding from melting glaciers. It has regions that are seasonally unavailable due to winter ice cover, areas too shallow and complicated to map such as the Sandman Reefs, and trenches so deep (>7,000 m) that standard seafloor mapping equipment does not work. As a result, many places in Alaska are uncharted or poorly charted, leaving great, unknown gaps to fill. Thus, I have been compiling bathymetry data sets, editing them, publishing them as regional bathymetry compilations, and conducting related analyses. I work with the General Bathymetric Chart of the Oceans, contributing to new seafloor maps of the Arctic, North Pacific, and the world for the Seabed 2030 project.
What do you like most about your current position?
My favorite aspects of this work are using my creativity to solve difficult, long-standing problems, making new discoveries, and working in well-functioning teams. Megan Prescott—an oceanographer, seafloor mapper, and GIS specialist—was my teammate for many projects over an eight year time span.
The western Gulf of Alaska map (from 2019) was the most complex map that Megan and I published. We cleaned and carefully stitched together 18 million depth observations from nearly 500 different data sources. Megan and I were able to depict numerous distinctive seafloor features, but we did not know what many of them were. So we worked with geologist Peter Haeussler (U.S. Geological Survey) who identified moraines and glacial scour marks left behind by the Last Glacial Maximum 20,000 years ago.
In 2018, a team of experts on tides, land movement, eelgrass beds and salmon habitat helped me determine the cause of shallowing in bays of the Chignik area on the Alaska Peninsula. We concluded that remobilized volcanic ash within the watersheds was trapped by eelgrass beds, enhancing sedimentation in shallow areas.
Also in 2018, Megan and I published a map of the eastern Bering Sea Slope, which is marked by some of the largest canyons in the world. We defined the number and locations of the canyons, identified them by their centerlines or thalwegs, and proved that the pinnacles in Zhemchug Canyon do not exist. These pinnacles have been on navigational charts for decades, and were even the target of a research survey , but they are just depth errors. As a result of this project, Megan and I submitted 45 seafloor place name descriptions and corrections to international, national, and local governing bodies for consideration.

Why do you think studying marine habitats is so important?
Seafloor depth, or bathymetry, is fundamental to describing fish habitat and oceanographic conditions. The distribution and abundance of nearly all of the species that we study is related to the depth of the seafloor. All of the fisheries research that we do is planned by depth. Estimating the size of fish populations also relies upon depth boundaries. Tides, currents, tsunamis, storm surges, sea-ice formation, and ecosystem productivity are all influenced by bathymetry.
What steps would you recommend someone take if they wanted to get a position as a fisheries scientist?
Read about the research. Experience the science. Find a way to mesh your natural skills with problems that need to be solved. Learn about the fishing industry and the environmental groups. Keep in mind that each fishery is different and has unique problems to solve. Because our work is coastal, the best example of a solution to a research problem might be thousands of miles away, across the continent or an ocean. Study the approaches other countries have taken to solving similar fisheries science problems and decide if that work might be appealing to you.
Think about the purpose of fisheries science and appreciate that the work we do is funded by the American taxpayer. Remember that we are responsible to the public and the resources that we manage, and understand the mandate for this research. Much of the fisheries science and management that we do was defined by the Magnuson–Stevens Fishery Conservation and Management Act, updates since 1996.
Working for the government can be truly rewarding. There are opportunities to be creative, make discoveries and engage in fruitful collaborations. As a civil servant you also have an important responsibility to conduct the science needed to support sustainable fisheries management and healthy marine resources.