The 2018 Eastern Bering Sea acoustic-trawl survey trackline (purple lines), and the planned line extensions (black and red lines) being surveyed by the saildrones as they head north.
Every other year, the NOAA Fisheries conducts an acoustic-trawl survey of the eastern Bering Sea in summer to estimate the distribution and abundance of walleye pollock. We have found during other surveys in the Eastern and Northern Bering Sea that pollock populations seem to be increasing in areas to the northeast of the traditional acoustic-trawl survey area. This year, the survey was extended further north to look for pollock that may be outside of the standard survey area (in the orange area of the map).
To increase the survey coverage, we are using saildrones to conduct two additional survey lines or transects in the green area during their journey from Dutch Harbor to the Bering Strait. We wanted to get an idea of how much pollock might be outside of the surveyed area, and whether these transects further to the east should be include in the next acoustic-trawl survey in 2020.
It took about five days for both saildrones to run the 280 nautical mile extensions. All systems appear to be working perfectly, and the data that we have received via satellite looks great. The survey lines were completed, and the saildrones are on their way around the east side of St. Lawrence Island and heading towards Bering Strait.

Researchers had to decide where to extend the current acoustic-trawl survey (shown in red), so historic survey data, including saildrone data collected in 2017, were used to prioritize where to spend time with the ship. The central region (orange) was determined to have a higher likelihood of pollock than the Russian (blue) or inner shelf (green) areas. (figure courtesy of Mike Levine)

The actual tracklines (black and red lines) of the saildrones. Just like any other sailboat, the saildrones must tack, or turn back and forth to sail at an angle, when sailing into the wind. The wind started to pick up from the north about halfway through the Bering Sea tracklines, resulting in the zig-zag pattern (data courtesy of Saildrone, Inc.).
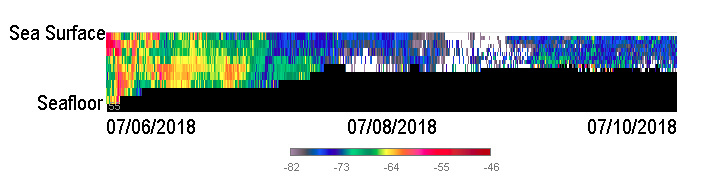
An echogram of the eastern trackline (black on the map above). Going from left to right, each data point represents the average backscatter over a 15-minute period as the saildrone moved from the southern point of the line (left) to northern point (right). The top of the echogram is the surface of the ocean, and the area in black on the bottom is the seafloor. Warmer colors (yellow-red on the color bar) indicate more backscatter from something in the water column (data courtesy of Saildrone, Inc.).