We are steaming back to Newport, Rhode Island from the Gulf of Maine after finishing the spring bottom trawl survey on the NOAA Ship Henry Bigelow. Last year’s spring bottom trawl survey was cut short because of COVID, and most of our data collection programs were canceled in 2020. It is good to be back on the water.

This survey started in March with three, 20-day legs. Each leg was a separate “bubble”: scientists and the ship’s officers and crew all followed the same pre-trip safety protocols. Once everyone was on the ship, the ‘bubble’ was formed—no one could join the “bubble” without following the same protocols. Three “bubbles” were used for the survey to give people a bit of a break between the 20-day legs, and to allow the exchange of ship personnel and scientists. Many people involved in the survey have spent nearly 60 days at sea and more than 20 days ashore in shelter-in-place.
The bottom trawl survey is a data-collecting machine. The survey extends from Cape Hatteras, North Carolina to the western Scotian Shelf. It has been conducted in the spring and fall of each year since the 1960s, with a few exceptions (like 2020!). Data is collected with a net called a bottom trawl. The opening of the trawl net is approximately 44 feet wide and 13 feet high. Instruments on the net measure the size of the opening and the depth, all in real time, from the ship.

Catch is sorted, identified, counted, and then data and samples are collected on length, weight, age, sex, maturity, stomach contents, and more. This spring, data on more than 180 species were collected. We took approximately:
- 9,000 age samples
- 6,000 stomach samples
- 10,000 sex and maturity determinations
- 900 energy content samples
In addition, thousands of other samples are collected and frozen for researchers across the Northeast region.
In addition to the bottom trawl, a variety of other data collection methods are used. Much smaller nets (2 feet wide) collect plankton. These are microscopic plants and animals that are the primary source of food for all marine animals. These smaller nets also capture fish eggs and larvae, complementing the data collected with the larger bottom trawl. Oceanographic data is collected with a conductivity-temperature-depth instrument deployed at every trawl location. These data help determine the effect of warming oceans on fish and shellfish species.

There is also a state-of-the-art instrument onboard for measuring carbon dioxide in the surface water. These data are used to understand the effect of ocean acidification on the marine ecosystem. Acoustic sensors are mapping the ocean bottom and measuring the abundance of fish in the water. Henry Bigelow—who was one of the pioneers of oceanography and the ship's namesake—would be impressed with the efficiency of the operation and the extent of data captured.

Across the Northeast Fisheries Science Center, data collection programs have been operating near 100 percent since the beginning of the year:
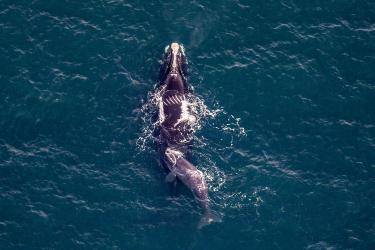
- Aerial surveys for right whales and seals
- Bottom longline survey for groundfish
- Ecosystem monitoring survey
- Shark survey
- Small boat work to study whales
- Field work to study Atlantic salmon
- Spring bottom trawl survey
In all cases, scientists and ship crews, captains, and officers have been taking a number of actions to reduce the risk of COVID, while still getting the work done. We will continue our survey efforts through the rest of the year.
The data collected from all of these programs contributes to fisheries management, protection and conservation of marine animals, evaluation of marine habitats, and an understanding of the effects of climate change on marine ecosystems.
Strong science leads to effective management. The Northeast U.S. ecosystem is one of the best studied ecosystems in the world and at our center, we intend to keep it this way.
Jon Hare, NEFSC Science and Research Director
Aboard the NOAA Ship Henry Bigelow